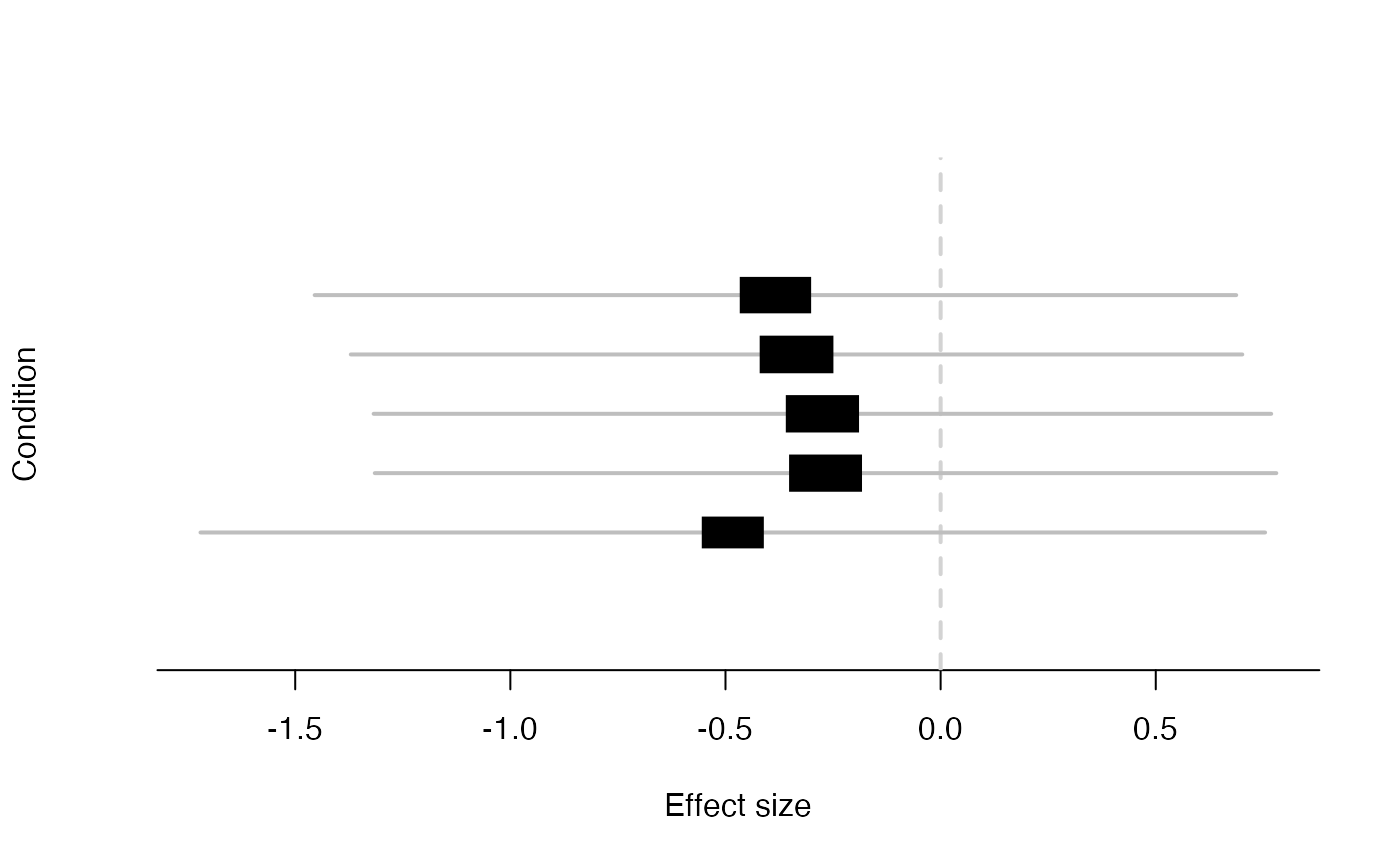
Plot metaplot for an effect based on posterior from mash
mash_plot_meta(m, i, xlab = "Effect size", ylab = "Condition", ...)Arguments
- m
the result of a mash fit
- i
index of the effect to plot
- xlab
Character string specifying x-axis label.
- ylab
Character string specifying y-axis label.
- ...
Additional arguments passed to
metaplot.
Examples
simdata = simple_sims(50,5,1)
data = mash_set_data(simdata$Bhat, simdata$Shat)
m = mash(data, cov_canonical(data))
#>  - Computing 200 x 151 likelihood matrix.
#>  - Likelihood calculations took 0.01 seconds.
#>  - Fitting model with 151 mixture components.
#>  - Model fitting took 0.20 seconds.
#>  - Computing posterior matrices.
#>  - Computation allocated took 0.00 seconds.
mash_plot_meta(m,1)
