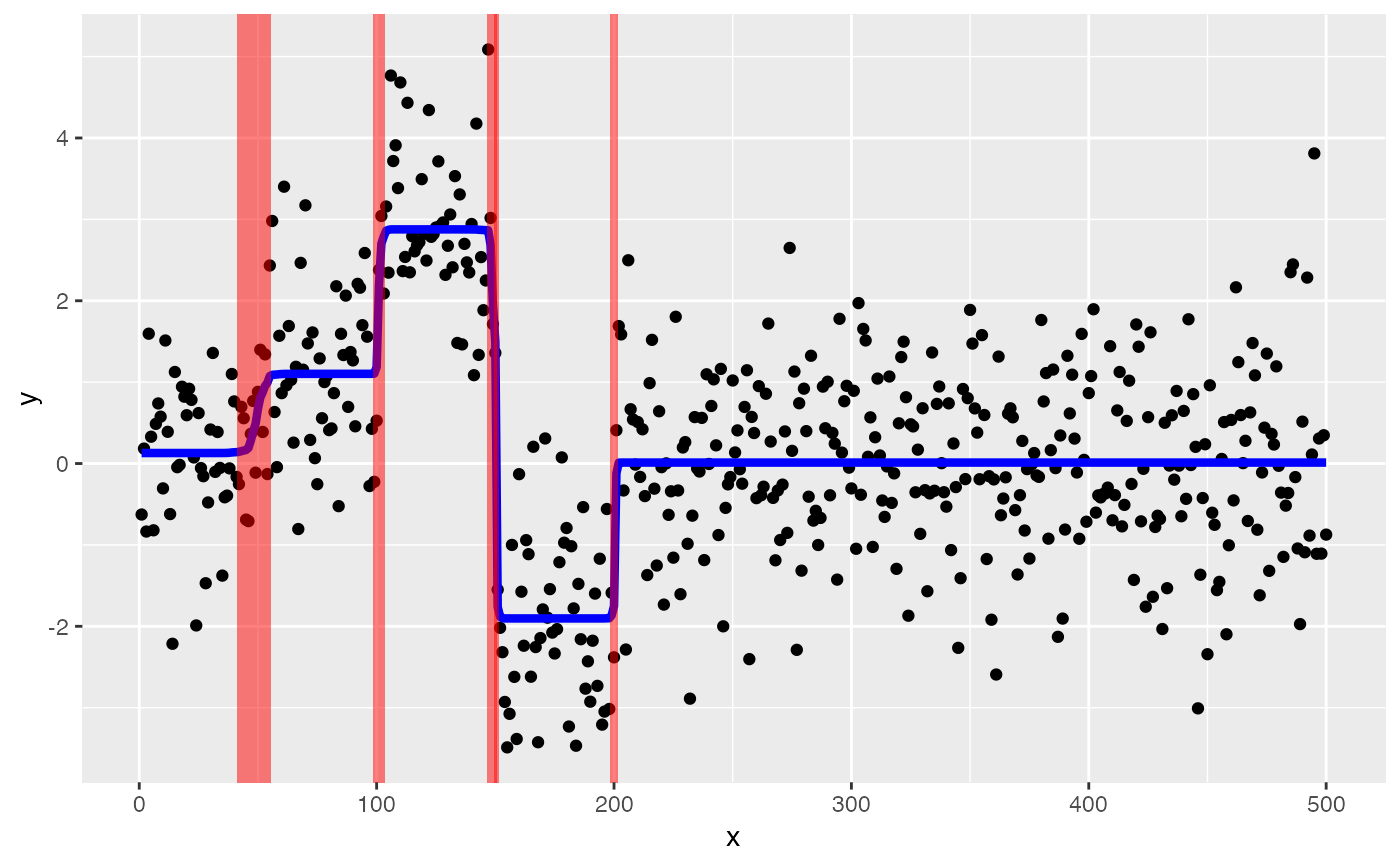
Plots original data, y, overlaid with line showing susie fitted value and shaded rectangles showing credible sets for changepoint locations.
Arguments
- s
A susie fit generated by
susie_trendfilter(y,order = 0).- y
An n-vector of observations that are ordered in time or space (assumed equally-spaced).
- line_col
Color for the line showing fitted values.
- line_size
Size of the lines showing fitted values
- cs_col
Color of the shaded rectangles showing credible sets.
Examples
set.seed(1)
mu <- c(rep(0, 50), rep(1, 50), rep(3, 50), rep(-2, 50), rep(0, 300))
y <- mu + rnorm(500)
# Here we use a less sensitive tolerance so that the example takes
# less time; in practice you will likely want to use a more stringent
# setting such as tol = 0.001.
s <- susie_trendfilter(y, tol = 0.1)

# Produces ggplot with credible sets for changepoints.
susie_plot_changepoint(s, y)
#> WARNING: Neither X nor Xcorr was provided; purity filtering is skipped and min_abs_corr will have no effect. Pass X or Xcorr to enable the purity filter.