This vignette demonstrates how to extract coefficient estimates and
make predictions from a fitted mvSuSiE model using the standard R
coef() and predict() methods.
Simulate data and split into training and test sets
We simulate multi-trait data using realistic genotypes and split the samples into training (80%) and test (20%) sets.
data(simdata)
X <- simdata$raw$X
n <- nrow(X)
p <- ncol(X)
r <- 10

# Simulate sparse effects: 4 causal SNPs affecting all traits
causal <- sort(sample(p, 4))
B <- matrix(0, p, r)
for (j in causal) B[j, ] <- rnorm(r, 0, 0.5)
Y <- X %*% B + matrix(rnorm(n * r), n, r)
cat(sprintf("Data: %d samples, %d SNPs, %d traits\n", n, p, r))
cat("Causal SNPs:", causal, "\n")
# Data: 574 samples, 1001 SNPs, 10 traits
# Causal SNPs: 129 679 836 930
train_idx <- sample(n, round(0.8 * n))
test_idx <- setdiff(seq_len(n), train_idx)
X_train <- X[train_idx, ]
Y_train <- Y[train_idx, ]
X_test <- X[test_idx, ]
Y_test <- Y[test_idx, ]
cat(sprintf("Training: %d samples, Test: %d samples\n",
            length(train_idx), length(test_idx)))
# Training: 459 samples, Test: 115 samples
Fit mvSuSiE and extract coefficients
We fit mvSuSiE using a canonical mixture prior. This is the simplest approach and requires no additional setup.
prior <- create_mixture_prior(R = r)
fit <- mvsusie(X_train, Y_train, L = 10,
               prior_variance = prior)
# mvsusie: N=459, J=1001, R=10, L=10 [mem: 0.17 GB]
# Residual variance set, common_cov=TRUE [mem: 0.17 GB]
# Prior: K=15 mixture components [mem: 0.17 GB]
# Eigendecomposition cache: K=15, common_cov=TRUE [mem: 0.17 GB]
# Model initialized: J=1001, R=10, L=10, K=15 [mem: 0.17 GB]
# iter          ELBO       delta   sigma2      mem      V
#    1    -6601.0847           -   diag[0.935,1.47]   0.18 GB  [1.32e-01, 3.75e-02, 2.46e-02, 0 x 7]
#    2    -6537.7785    6.33e+01   diag[0.834,1.06]   0.18 GB  [1.15e-01, 3.21e-02, 2.08e-02, 0 x 7]
#    3    -6537.7675    1.10e-02   diag[0.833,1.06]   0.18 GB  [1.15e-01, 3.21e-02, 2.08e-02, 0 x 7]
#    4    -6537.7675    6.37e-07   diag[0.833,1.06]   0.18 GB  [1.15e-01, 3.21e-02, 2.08e-02, 0 x 7]  converged
cat("Credible sets:", length(fit$sets$cs), "\n")
# Credible sets: 3
The coef() method returns a (J+1) \times R matrix. The first row is the
intercept; the remaining J rows are the
regression coefficients.
beta_hat <- coef(fit)
cat(sprintf("Coefficient matrix: %d x %d (including intercept)\n",
            nrow(beta_hat), ncol(beta_hat)))
# Coefficient matrix: 1002 x 10 (including intercept)
beta_est <- beta_hat[-1, ]  # Remove intercept row
pdat <- data.frame(true = as.vector(B),
                   estimated = as.vector(beta_est))
ggplot(pdat, aes(x = true, y = estimated)) +
  geom_point(shape = 20, size = 1.5, color = "royalblue", alpha = 0.3) +
  geom_abline(intercept = 0, slope = 1, linetype = "dotted") +
  labs(x = "True coefficient", y = "Estimated coefficient") +
  theme_cowplot(font_size = 12)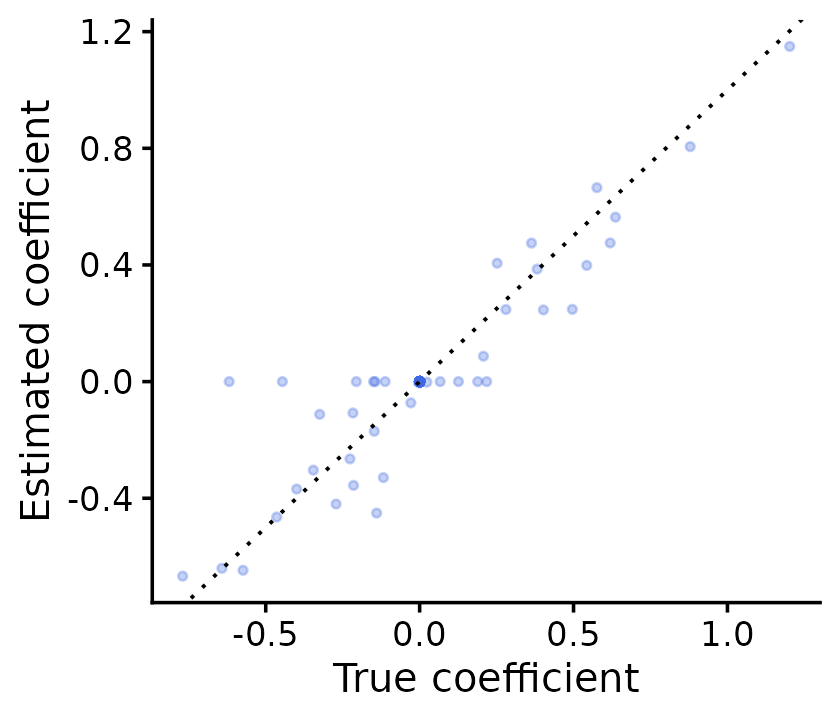
In-sample and out-of-sample prediction
Calling predict() without a new data matrix returns the
fitted values from the training data. To predict on new data, pass the
test genotype matrix via the newx argument.
Y_fitted <- predict(fit)
Y_pred <- predict(fit, newx = X_test)
cat(sprintf("In-sample RMSE: %.4f\n", sqrt(mean((Y_train - Y_fitted)^2))))
cat(sprintf("Out-of-sample RMSE: %.4f\n", sqrt(mean((Y_test - Y_pred)^2))))
# In-sample RMSE: 0.9940
# Out-of-sample RMSE: 1.0171
pdat <- data.frame(
  observed = c(Y_test[, 1], Y_test[, 2]),
  predicted = c(Y_pred[, 1], Y_pred[, 2]),
  trait = rep(c("Trait 1", "Trait 2"), each = nrow(Y_test))
)
ggplot(pdat, aes(x = observed, y = predicted)) +
  geom_point(shape = 20, size = 1.5, color = "royalblue", alpha = 0.6) +
  geom_abline(intercept = 0, slope = 1, linetype = "dotted") +
  facet_wrap(~trait) +
  labs(x = "Observed", y = "Predicted") +
  theme_cowplot(font_size = 12)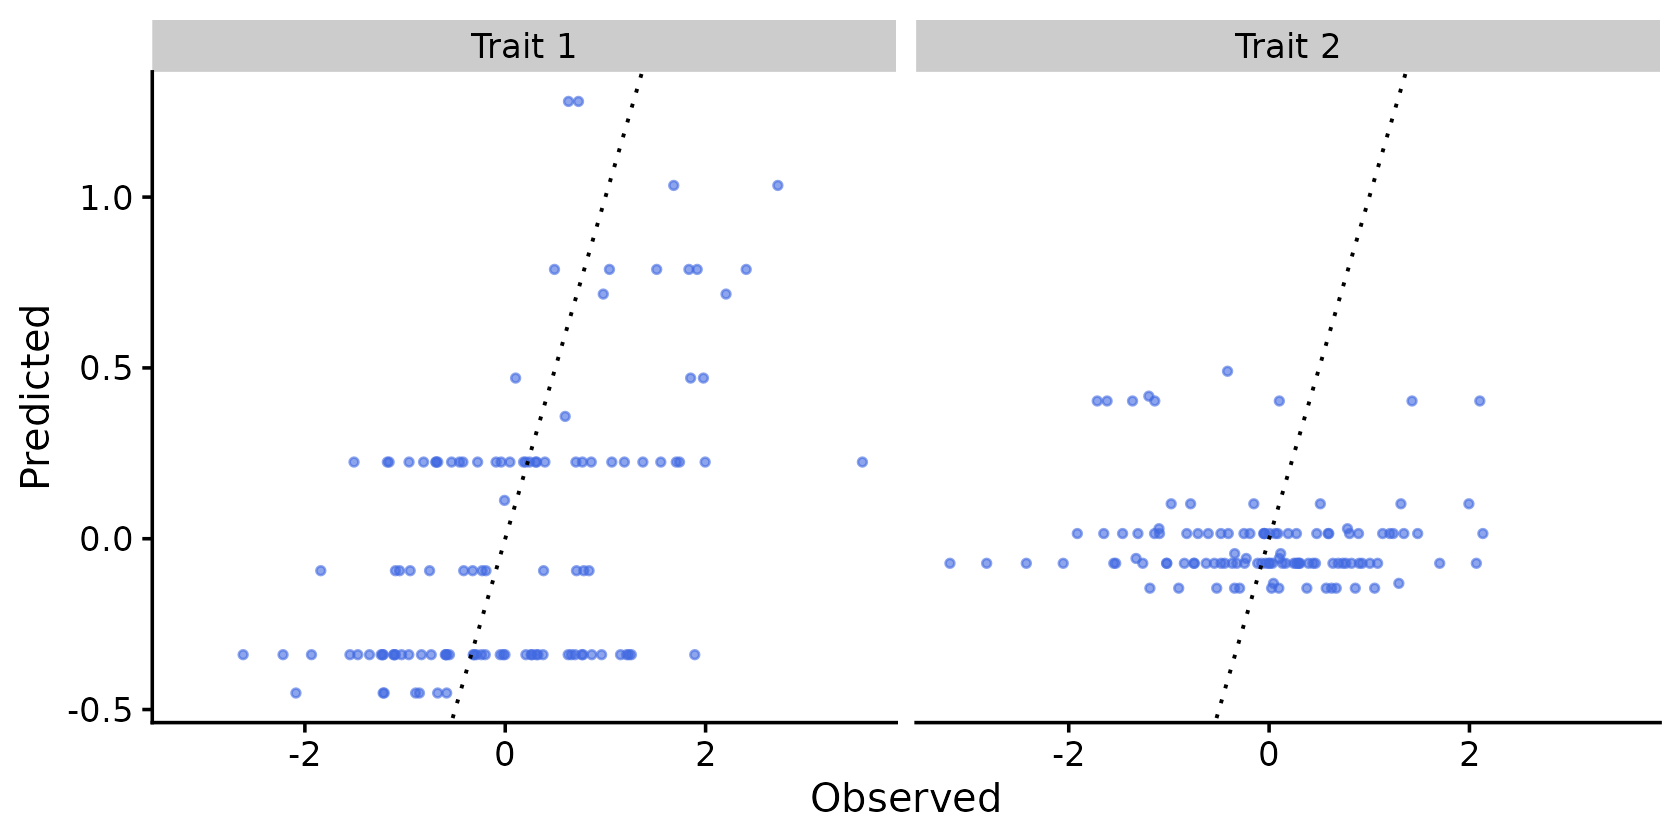
Per-trait prediction accuracy:
cor_per_trait <- sapply(seq_len(r), function(i)
  cor(Y_pred[, i], Y_test[, i]))
rmse_per_trait <- sapply(seq_len(r), function(i)
  sqrt(mean((Y_test[, i] - Y_pred[, i])^2)))

results <- data.frame(
  trait = paste0("trait", seq_len(r)),
  correlation = round(cor_per_trait, 3),
  rmse = round(rmse_per_trait, 4)
)
results
#      trait correlation   rmse
# 1   trait1       0.512 0.9972
# 2   trait2      -0.069 1.0415
# 3   trait3       0.404 0.9892
# 4   trait4       0.468 1.0877
# 5   trait5       0.325 0.9212
# 6   trait6       0.334 0.9895
# 7   trait7       0.602 1.0308
# 8   trait8       0.296 0.9651
# 9   trait9       0.271 1.1216
# 10 trait10       0.301 1.0123
Using a data-driven prior for prediction
A data-driven prior learned via mashr can potentially improve predictions by better capturing the true effect-sharing patterns across traits. See the prior specification vignette for details on constructing data-driven priors.
library(mashr)

# Learn prior from marginal z-scores
Z_train <- calc_z(X_train, Y_train, center = TRUE, scale = TRUE)
mash_data <- mash_set_data(Bhat = Z_train,
                           Shat = matrix(1, nrow(Z_train), r))
U_c <- cov_canonical(mash_data)
m_fit <- mash(mash_data, Ulist = U_c, outputlevel = 0)
prior_dd <- create_mixture_prior(fitted_g = m_fit$fitted_g)

# Fit with data-driven prior
fit_dd <- mvsusie(X_train, Y_train, L = 10,
                  prior_variance = prior_dd)
#  - Computing 1001 x 271 likelihood matrix.
#  - Likelihood calculations took 0.04 seconds.
#  - Fitting model with 271 mixture components.
#  - Model fitting took 0.38 seconds.
Y_pred_dd <- predict(fit_dd, newx = X_test)
cor_dd <- sapply(seq_len(r), function(i) cor(Y_pred_dd[, i], Y_test[, i]))
pdat <- data.frame(canonical = cor_per_trait, data_driven = cor_dd)
ggplot(pdat, aes(x = canonical, y = data_driven)) +
  geom_point(shape = 20, size = 3, color = "royalblue") +
  geom_abline(intercept = 0, slope = 1, linetype = "dotted") +
  labs(x = "Correlation (canonical prior)",
       y = "Correlation (data-driven prior)") +
  theme_cowplot(font_size = 12)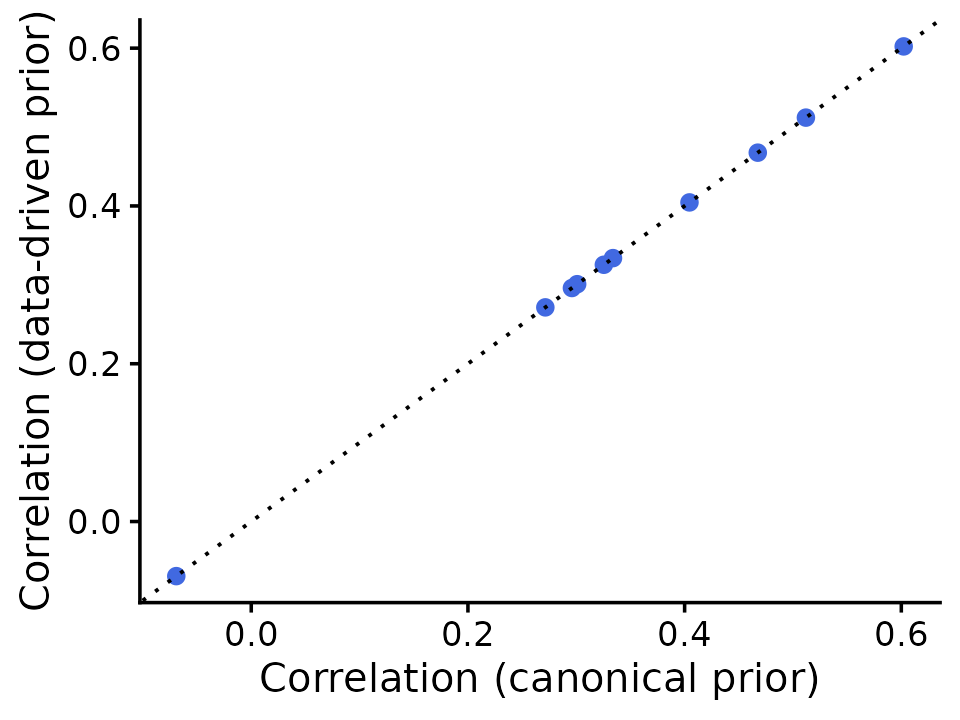
In this simple simulation, the canonical and data-driven priors give same prediction accuracy. The data-driven approach is more likely to help when the true effect-sharing patterns are complex and poorly captured by canonical patterns.