Simulate an Entire Observed Dataset from a Randomly Generated Function
Source:R/07_simulate.R
simulate_process.RdThis function automates the process of generating a random underlying function (of various types) and then sampling noisy observations from it, returning a complete simulated dataset.
simulate_process(
  x = NULL,
  n_basis = 50,
  sd_fun = 1,
  sd = 0.1,
  sd_poly = 0.1,
  type = c("linear", "nonlinear", "quadratic", "nondynamic"),
  p = 1,
  pred_step = 16,
  normalize = FALSE
)
Arguments
- x
A numeric vector specifying the grid points where the function is evaluated.
- n_basis
An integer specifying the number of basis functions (for
"nonlinear"type).- sd_fun
A numeric value controlling the smoothness of the function under the IWP prior.
- sd
A numeric value or vector specifying the standard deviation(s) of observation noise.
- sd_poly
A numeric value specifying the standard deviation for polynomial coefficients.
- type
A character string specifying the type of function to simulate. One of
"linear","quadratic","nonlinear", or"nondynamic".- p
An integer specifying the order of the polynomial trend in the nonlinear model.
- pred_step
A numeric value representing the resolution parameter for scaling the IWP precision.
- normalize
A logical value indicating whether to rescale the function to roughly zero mean and unit range.
Value
A data frame containing:
xGrid points where the function is evaluated.
yNoisy observed values.
truefTrue underlying function values at each
x.sdNoise standard deviation used at each point.
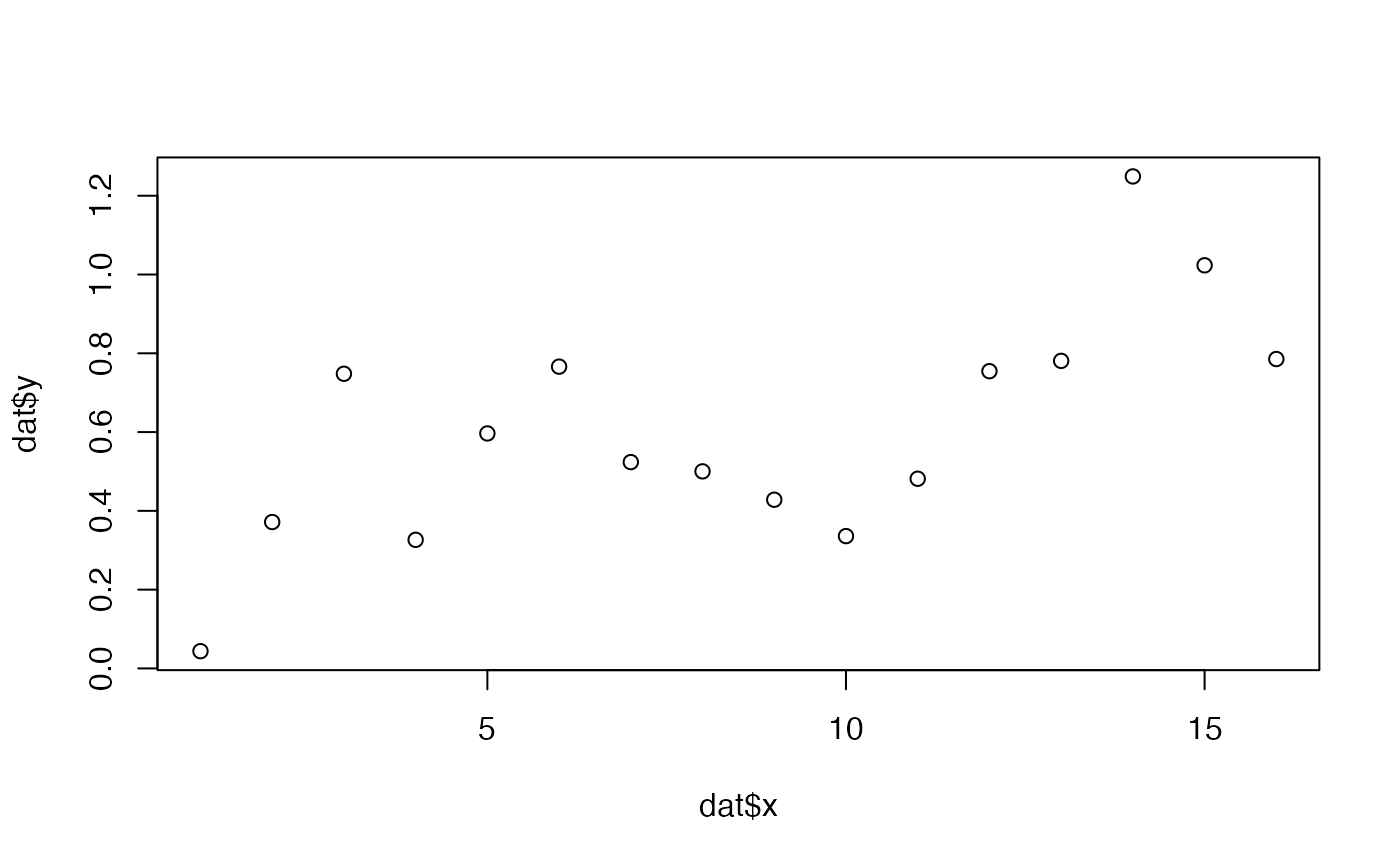
Examples
dat <- simulate_process(type = "nonlinear")
plot(dat$x, dat$y)