Effect of data transformation in null data
Joyce Hsiao
2019-05-07
Last updated: 2019-05-10
Checks: 6 0
Knit directory: dsc-log-fold-change/
This reproducible R Markdown analysis was created with workflowr (version 1.3.0). The Checks tab describes the reproducibility checks that were applied when the results were created. The Past versions tab lists the development history.
Great! Since the R Markdown file has been committed to the Git repository, you know the exact version of the code that produced these results.
Great job! The global environment was empty. Objects defined in the global environment can affect the analysis in your R Markdown file in unknown ways. For reproduciblity it’s best to always run the code in an empty environment.
The command set.seed(20181115) was run prior to running the code in the R Markdown file. Setting a seed ensures that any results that rely on randomness, e.g. subsampling or permutations, are reproducible.
Great job! Recording the operating system, R version, and package versions is critical for reproducibility.
Nice! There were no cached chunks for this analysis, so you can be confident that you successfully produced the results during this run.
Great! You are using Git for version control. Tracking code development and connecting the code version to the results is critical for reproducibility. The version displayed above was the version of the Git repository at the time these results were generated.
Note that you need to be careful to ensure that all relevant files for the analysis have been committed to Git prior to generating the results (you can use wflow_publish or wflow_git_commit). workflowr only checks the R Markdown file, but you know if there are other scripts or data files that it depends on. Below is the status of the Git repository when the results were generated:
Ignored files:
    Ignored:    .Rhistory
    Ignored:    .Rproj.user/
    Ignored:    .sos/
    Ignored:    analysis/.sos/
    Ignored:    dsc/.sos/
    Ignored:    dsc/benchmark/
    Ignored:    dsc/data/filtered_gene_bc_matrices/
    Ignored:    dsc/dsc_test/.sos/
    Ignored:    output/

Unstaged changes:
    Modified:   analysis/eval_initial.Rmd
    Modified:   dsc/benchmark.dsc
    Modified:   dsc/benchmark.sh
    Modified:   dsc/modules/transform_data.R
Note that any generated files, e.g. HTML, png, CSS, etc., are not included in this status report because it is ok for generated content to have uncommitted changes.
These are the previous versions of the R Markdown and HTML files. If you’ve configured a remote Git repository (see ?wflow_git_remote), click on the hyperlinks in the table below to view them.
| File | Version | Author | Date | Message |
|---|---|---|---|---|
| Rmd | 4f25ca2 | Joyce Hsiao | 2019-05-10 | update results |
| html | e6fb98b | Joyce Hsiao | 2019-05-10 | Build site. |
| Rmd | 5d43eb7 | Joyce Hsiao | 2019-05-10 | update results |
| html | 5c509fe | Joyce Hsiao | 2019-05-09 | Build site. |
| Rmd | 9881cca | Joyce Hsiao | 2019-05-09 | add summary of the results |
| html | fcfa1ef | Joyce Hsiao | 2019-05-08 | Build site. |
| Rmd | 70a66d1 | Joyce Hsiao | 2019-05-08 | update results |
| html | 7489ead | Joyce Hsiao | 2019-05-08 | Build site. |
| Rmd | dd43766 | Joyce Hsiao | 2019-05-08 | update results |
| html | a4c5501 | Joyce Hsiao | 2019-05-08 | Build site. |
| Rmd | eafe173 | Joyce Hsiao | 2019-05-08 | downstream effects of data transformation methods in null datasets: initial assessment |
Summary
Applying data transformation methods to single-cell gene expression count and computing type I error rate in null datasets.
When library sizes are the same between two groups, except for edgeR which has poor control over type I error at alpha < .01, all other methods are able to control for type I error.
When sample library size in one group is 2 times the library size in the other group all methods perform pooly, except for the method that applies t-test to Pearson’s residuals (Hafemeister and Satija, 2019). We observed similar results after increasing library size factor to 2 (group 1 sample size \(2^2\) times of group 2 sample size).
Data transformation methods compared:
\(X_{ig}\): gene expression count in cell \(i\) from gene \(g\)
\(X_{i+}\): gene expression count in cell \(i\), i.e., \(X_{i+} = \sum_g X_{ig}\)
\(S_i\): library size normalization factor for cell \(i\)
\(p\): a positive pseudo-count added to expression matrix; traditionally it is used to ensure log-transformation of the expression matrix is well-defined. For now we use pseudo-count of 1.
log2_none_p1: \(log2(X_{ig} + p)\) where \(p=1\).log2_libsum_p1: \(log2(X_{ig}/X_{i+} + p)\) where \(p=1\). Commonly know astotal sum normalizationortota count normalization. This methods assumes that the true library size is the same across cells.log2_libscale_TMM_p1: \(log2(X_{ig}/S_{i} + p)\) where \(p=1\) using edgeR TMM method to estimate \(S_i\).log2_libscale_RLE_p1: \(log2(X_{ig}/S_{i} + p)\) where \(p=1\) using DESeq2 RLE (Relative Log Expression) method to estimate \(S_i\). This method assumes that gene expression distribution across samples should be similar, and to account for outlier genes, they let the medians of gene expression distribution to be the same across samples (cells). The size factor of the library size is estimated to be the median of the ratios of observed counts:
\[ \widehat{S}_i = \text{median}_g \frac{X_{ig}}{(\prod^N_{n=1}X_{ig})^{1/N}} \]
counts_pearsons: Pearson’s residuals of expression counts, derived usingsctransform(Hafemeister and Satija, 2019).
Pipelines compared:
- DEseq2: count data + RLE transformation
- edgeR: count data + TMM transformation
- limma_voom + data transformation 1-4
- t-test + all 5 data transformation methods listed above
More about counts_pearson:
For a given gene \(g\), use the sum of all molecules assigned to a cell as a proxy for sequencing depth, and use this cell attribute in a regression model with negative binomial distribution and log link function. Thus, let \(X_g\) be the vector of UMI counts assigned to gene \(g\), and \(m\) be the vector of molecules assigned to the cells, i.e., \(m_i = \sum_i X_{ig}\). For a given \(g\), we have
\(log(E(X_g)) = \beta_0 + \beta_1 log10 m\)
Using the NB parametrization with mean \(\mu\) and variance \(\mu + \mu^2/\theta\),
Pearson’s residuals are defined as:
\(z_{ig} = (X_{ig}-\mu_{ig})/\sigma_{ig}\)
where
\(\mu_{ig} = exp(\beta_{0g} + \beta_{1g}log10 m_i)\),
\(\sigma_{ig} = \sqrt(\mu_{ig} + \mu^2_{ig}/\theta_{g})\)
Data simulation parameters:
- 100 cells (50 vs 50)
- libsize_factor: 0, 1, 2 (group 1 is 2^0, 2^1 and 2^2 of group 2)
- 1K genes randomly drawn
- 100% null genes
- 50 simulated datasets
Required packages and functions
library(tidyverse)
library(seqgendiff)
library(sctransform)
#source("dsc/modules/poisthin.R")
source("dsc/modules/filter_genes.R")
source("dsc/modules/transform_data.R")
source("dsc/modules/t_test.R")
source("dsc/modules/wilcoxon.R")
source("dsc/modules/limma_voom.R")
source("dsc/modules/edger.R")
source("dsc/modules/deseq2.R")
source("dsc/modules/sva.R")

run_methods <- function(data_obj, nsim, verbose=F) {

  Y <- t(data_obj$Y)
  X <- data_obj$X
  beta <- data_obj$beta
  keep_genes <- filter_genes(Y, min_cell_detected=5)
  Y <- Y[keep_genes,]
  beta <- beta[keep_genes]

  foo_m <- do.call(rbind, lapply(1:length(de_methods_list), function(j) {

  if (de_methods_list[j] == "edger") {
    if (verbose) message("edger")
      res <- edger(Y=Y, X=X)
      pvals <- res$pval
      return(data.frame(type1error_01=mean(pvals < .01, na.rm=TRUE),
                        type1error_001=mean(pvals < .001, na.rm=TRUE),
                        mse = mean((res$est - beta)^2, na.rm=T),
                        transform_method = de_methods_list[j],
                        de_method = de_methods_list[j],
                        nsim = nsim))
  }
  if (de_methods_list[j] == "deseq2") {
      if (verbose) message("deseq2")
      res <- deseq2(Y=Y, X=X)
      pvals <- res$pval
      return(data.frame(type1error_01=mean(pvals < .01, na.rm=TRUE),
                        type1error_001=mean(pvals < .001, na.rm=TRUE),
                        mse = mean((res$est - beta)^2, na.rm=T),
                        transform_method = de_methods_list[j],
                        de_method = de_methods_list[j],
                        nsim = nsim))
  }
  if (de_methods_list[j] == "limma") {
      if (verbose) message("limma")
      foo_l <- do.call(rbind, lapply(1:(length(transform_methods_list)-1), function(k) {
          if (transform_methods_list[k] == "log2_none_p1") {
          transformed_Y <- transform_data(Y, libscale_method = "none",
                                          log="log2", pseudo_count=1)
          }
          if (transform_methods_list[k] == "log2_libsum_p1") {
          transformed_Y <- transform_data(Y, libscale_method = "sum",
                                          log="log2", pseudo_count=1)
          }
          if (transform_methods_list[k] == "log2_libscale_TMM_p1") {
          transformed_Y <- transform_data(Y, libscale_method = "TMM",
                                          log="log2", pseudo_count=1)
          }
          if (transform_methods_list[k] == "log2_libscale_RLE_p1") {
          transformed_Y <- transform_data(Y, libscale_method = "RLE",
                                          log="log2", pseudo_count=1)
          }
          if (sum(is.na(transformed_Y))==nrow(transformed_Y)*ncol(transformed_Y)) {
          return(data.frame(type1error_01=NA,
                            type1error_001=NA,
                            mse=NA,
                            transform_method = transform_methods_list[k],
                            de_method = de_methods_list[j],
                            nsim = nsim))
          } else {
          fit <- lmFit(transformed_Y,design=X)
          fit.ebayes <- eBayes(fit)
          pvals <- fit.ebayes$p.value[,2]
          return(data.frame(type1error_01=mean(pvals < .01, na.rm=TRUE),
                            type1error_001=mean(pvals < .001, na.rm=TRUE),
                            mse=mean((fit.ebayes$coefficients[,2]-beta)^2,na.rm=T),
                            transform_method = transform_methods_list[k],
                            de_method = de_methods_list[j],
                            nsim = nsim))
          }
      }) )
      return(foo_l)
    }
  if (de_methods_list[j] == "limma_voom") {
      if (verbose) message("limma_voom")
      res <- limma_voom(Y=Y, X=X)
      pvals <- res$pvalue
      return(data.frame(type1error_01=mean(pvals < .01, na.rm=TRUE),
                        type1error_001=mean(pvals < .001, na.rm=TRUE),
                        mse=mean((res$betahat-beta)^2,na.rm=T),
                        transform_method = de_methods_list[j],
                        de_method = de_methods_list[j],
                        nsim = nsim))
  }
  if (de_methods_list[j] == "limma_voom_libscale_tmm") {
  if (verbose) message("limma_voom_libscale_tmm")
  libnorm_factors <- edgeR::calcNormFactors(Y, method="TMM")
  res <- limma_voom(Y, X, libnorm_factors=libnorm_factors)
  pvals <- res$pvalue
  return(data.frame(type1error_01=mean(pvals < .01, na.rm=TRUE),
                    type1error_001=mean(pvals < .001, na.rm=TRUE),
                    mse=mean((res$betahat-beta)^2,na.rm=T),
                    transform_method = de_methods_list[j],
                    de_method = de_methods_list[j],
                    nsim = nsim))
  }
  if (de_methods_list[j] == "limma_voom_libscale_rle") {
    if (verbose) message("limma_voom_libscale_rle")
    libnorm_factors <- edgeR::calcNormFactors(Y, method="RLE")
    if (anyNA(libnorm_factors)) {
    return(data.frame(type1error_01=NA,
                      type1error_001=NA,
                      mse=NA,
                      transform_method = de_methods_list[j],
                      de_method = de_methods_list[j],
                      nsim = nsim))
    } else {
    res <- limma_voom(Y, X, libnorm_factors=libnorm_factors)
    pvals <- res$pvalue
    return(data.frame(type1error_01=mean(pvals < .01, na.rm=TRUE),
                      type1error_001=mean(pvals < .001, na.rm=TRUE),
                      mse=mean((res$betahat-beta)^2,na.rm=T),
                      transform_method = de_methods_list[j],
                      de_method = de_methods_list[j],
                      nsim = nsim))
    }
  }
  if (de_methods_list[j] == "sva_limma_voom") {
      if (verbose) message("sva_limma_voom")
      output_sva <- sva(Y, X)
      res <- limma_voom(Y, X=output_sva$X.sv)
      pvals <- res$pval
      return(data.frame(type1error_01=mean(pvals < .01, na.rm=TRUE),
                        type1error_001=mean(pvals < .001, na.rm=TRUE),
                        mse=mean((res$betahat-beta)^2,na.rm=T),
                        transform_method = de_methods_list[j],
                        de_method = de_methods_list[j],
                        nsim = nsim))
  }
  if (de_methods_list[j] == "t_test") {
      if (verbose) message("t_test")
      foo_t <- do.call(rbind, lapply(1:length(transform_methods_list), function(k) {
          if (transform_methods_list[k] == "log2_none_p1") {
          transformed_Y <- transform_data(Y, libscale_method = "none",
                                          log="log2", pseudo_count=1)
          }
          if (transform_methods_list[k] == "log2_libsum_p1") {
          transformed_Y <- transform_data(Y, libscale_method = "sum",
                                          log="log2", pseudo_count=1)
          }
          if (transform_methods_list[k] == "log2_libscale_TMM_p1") {
          transformed_Y <- transform_data(Y, libscale_method = "TMM",
                                          log="log2", pseudo_count=1)
          }
          if (transform_methods_list[k] == "log2_libscale_RLE_p1") {
          transformed_Y <- transform_data(Y, libscale_method = "RLE",
                                          log="log2", pseudo_count=1)
          }
          if (transform_methods_list[k] == "counts_pearsons") {
          transformed_Y <- transform_data(Y, libscale_method = "pearsons_residual",
                                          log="none", pseudo_count=1)
          }
          res <- t_test(transformed_Y, X)
          pvals <- res[2,]
          return(data.frame(type1error_01=mean(pvals < .01, na.rm=TRUE),
                            type1error_001=mean(pvals < .001, na.rm=TRUE),
                            mse=mean((res[1,]-beta)^2,na.rm=T),
                            transform_method = transform_methods_list[k],
                            de_method = de_methods_list[j],
                            nsim = nsim))
      }) )
      return(foo_t)
    }
  }) )
   return(foo_m)
}


transform_methods_list <- c("log2_none_p1", "log2_libsum_p1", "log2_libscale_TMM_p1",
                            "log2_libscale_RLE_p1", "counts_pearsons")
de_methods_list <- c("edger", "deseq2", "limma", "limma_voom",
                     "limma_voom_libscale_tmm",
                     "limma_voom_libscale_rle",
                     "sva_limma_voom", "t_test")
No differences in library sizes
Simulations
counts <- readRDS("dsc/data/pbmc_counts.rds")
nsamp <- 100
ngene <- 1000
prop_null <- 0
libsize_factor <- 0
signal_fun <- function(n) rep(libsize_factor, n)
signal_params <- list()
#pvals_thres <- .001
nsim <- 50
for (i in 1:nsim) {
  set.seed(i)
  data_obj <- poisthin(t(counts), nsamp=nsamp, ngene=ngene,
                       signal_params=signal_params, signal_fun=signal_fun,
                       prop_null = prop_null)
  saveRDS(data_obj, file = paste0("output/transform_null.Rmd/data_obj_",i,".rds"))
}


out <- do.call(rbind, lapply(1:nsim, function(i) {
  print(i)
  data_obj <- readRDS(file = paste0("output/transform_null.Rmd/data_obj_",i,".rds"))

  res <- run_methods(data_obj, i, verbose=T)
  return(res)
  }) )

out$method <- as.character(out$de_method)
which_relabel <- which(as.character(out$de_method) != as.character(out$transform_method))
out$method[which_relabel] <- paste(as.character(out$de_method), as.character(out$transform_method), sep="_")[which_relabel]

out$method <- factor(out$method)

saveRDS(out, file = "output/transform_null.Rmd/libfactor_0.rds")
Results
#alpha <- .001
out <- readRDS(file = "output/transform_null.Rmd/libfactor_0.rds")
levels(out$method)
[1] "deseq2" "edger"
[3] "limma_log2_libscale_RLE_p1" "limma_log2_libscale_TMM_p1"
[5] "limma_log2_libsum_p1" "limma_log2_none_p1"
[7] "limma_voom" "limma_voom_libscale_rle"
[9] "limma_voom_libscale_tmm" "sva_limma_voom"
[11] "t_test_counts_pearsons" "t_test_log2_libscale_RLE_p1"
[13] "t_test_log2_libscale_TMM_p1" "t_test_log2_libsum_p1"
[15] "t_test_log2_none_p1" out %>% #filter(n1==50) %>%
group_by(method) %>%
ggplot(., aes(x=method, y=type1error_001, col=method)) +
# facet_wrap(~de_method) +
geom_boxplot() + geom_point() + xlab("Type 1 error at alpha < .001") +
geom_hline(yintercept = .001, col="gray50") +
ylab("Type I error") +
scale_x_discrete(position = "top") +
theme(axis.text.x=element_text(angle = 20, vjust = -.3, hjust=.1)) +
stat_summary(fun.y=mean, geom="point", shape=4, size=4, col="black")
| Version | Author | Date |
|---|---|---|
| e6fb98b | Joyce Hsiao | 2019-05-10 |
out %>% #filter(n1==50) %>%
    group_by(method) %>%
    ggplot(., aes(x=method, y=type1error_01, col=method)) +
#        facet_wrap(~de_method) +
        geom_boxplot() + geom_point() + xlab("Type 1 error at alpha < .01") +
        geom_hline(yintercept = .01, col="gray50") +
        ylab("Type I error") +
      scale_x_discrete(position = "top") +
       theme(axis.text.x=element_text(angle = 20, vjust = -.3, hjust=.1)) +
       stat_summary(fun.y=mean, geom="point", shape=4, size=4, col="black")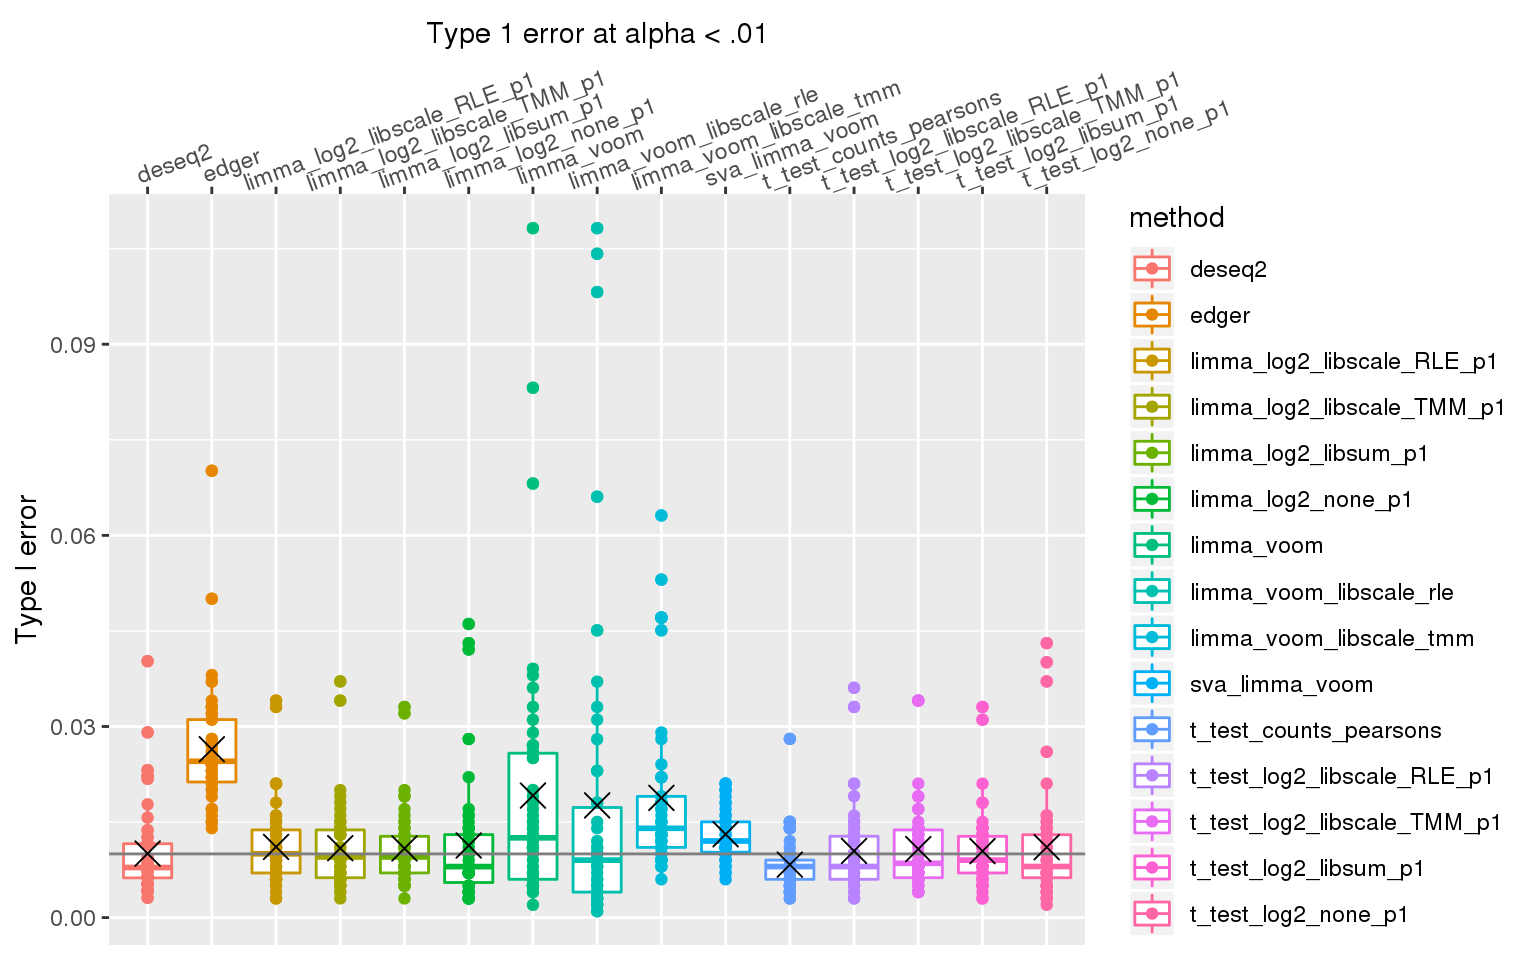
| Version | Author | Date |
|---|---|---|
| e6fb98b | Joyce Hsiao | 2019-05-10 |
out %>% #filter(n1==50) %>%
    group_by(nsim, method) %>%
    summarise(mse_mn =mean(mse, na.rm=T)) %>%
    ggplot(., aes(x=method, y=mse_mn, col=method)) +
#        facet_wrap(~de_method) +
        geom_boxplot() + geom_point() + xlab("Mean squared error") +
        ylab("Mean squared error") +
      scale_x_discrete(position = "top") +
       theme(axis.text.x=element_text(angle = 20, vjust = -.3, hjust=.1)) +
       stat_summary(fun.y=mean, geom="point", shape=4, size=4, col="black")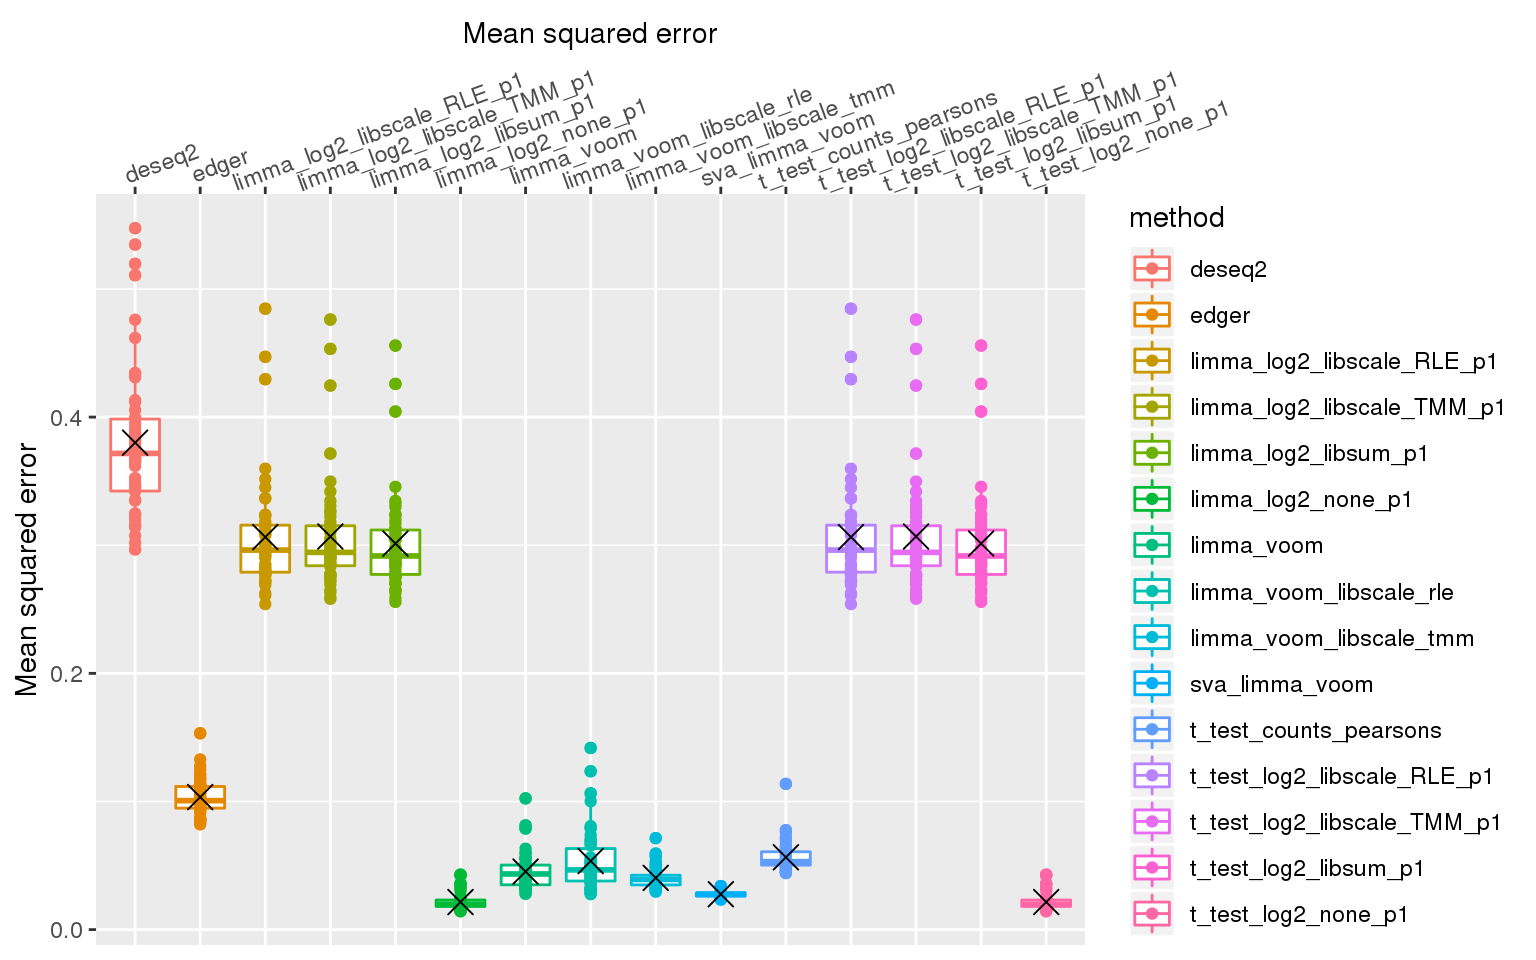
| Version | Author | Date |
|---|---|---|
| e6fb98b | Joyce Hsiao | 2019-05-10 |
library size factor 1
Simulation
counts <- readRDS("dsc/data/pbmc_counts.rds")
nsamp <- 100
ngene <- 1000
prop_null <- 0
libsize_factor <- 1
signal_fun <- function(n) rep(libsize_factor, n)
signal_params <- list()
#pvals_thres <- .001
nsim <- 50
for (i in 1:nsim) {
  set.seed(i)
  data_obj <- poisthin(t(counts), nsamp=nsamp, ngene=ngene,
                       signal_params=signal_params, signal_fun=signal_fun,
                       prop_null = prop_null)
  saveRDS(data_obj, file = paste0("output/transform_null.Rmd/data_obj_libfactor_1_",i,".rds"))
}


nsim=50
out <- do.call(rbind, lapply(1:nsim, function(i) {

  data_obj <- readRDS(file = paste0("output/transform_null.Rmd/data_obj_libfactor_1_",
                                    i,".rds"))

  res <- run_methods(data_obj, i)
  return(res)
  }) )

out$method <- as.character(out$de_method)
which_relabel <- which(as.character(out$de_method) != as.character(out$transform_method))
out$method[which_relabel] <- paste(as.character(out$de_method), as.character(out$transform_method), sep="_")[which_relabel]
out$method <- factor(out$method)

saveRDS(out, file = "output/transform_null.Rmd/libfactor_1.rds")
Results
#alpha <- .001
out <- readRDS(file = "output/transform_null.Rmd/libfactor_1.rds")

levels(out$method)
[1] "deseq2" "edger"
[3] "limma_log2_libscale_RLE_p1" "limma_log2_libscale_TMM_p1"
[5] "limma_log2_libsum_p1" "limma_log2_none_p1"
[7] "limma_voom" "limma_voom_libscale_rle"
[9] "limma_voom_libscale_tmm" "sva_limma_voom"
[11] "t_test_counts_pearsons" "t_test_log2_libscale_RLE_p1"
[13] "t_test_log2_libscale_TMM_p1" "t_test_log2_libsum_p1"
[15] "t_test_log2_none_p1" out %>% #filter(n1==50) %>%
group_by(method) %>%
ggplot(., aes(x=method, y=type1error_001, col=method)) +
# facet_wrap(~de_method) +
geom_boxplot() + geom_point() + xlab("Type 1 error at alpha < .001") +
geom_hline(yintercept = .001, col="gray50") +
ylab("Type I error") +
scale_x_discrete(position = "top") +
theme(axis.text.x=element_text(angle = 20, vjust = -.3, hjust=.1)) +
stat_summary(fun.y=mean, geom="point", shape=4, size=4, col="black")
| Version | Author | Date |
|---|---|---|
| e6fb98b | Joyce Hsiao | 2019-05-10 |
out %>% #filter(n1==50) %>%
    group_by(method) %>%
    ggplot(., aes(x=method, y=type1error_01, col=method)) +
#        facet_wrap(~de_method) +
        geom_boxplot() + geom_point() + xlab("Type 1 error at alpha < .01") +
        geom_hline(yintercept = .01, col="gray50") +
        ylab("Type I error") +
      scale_x_discrete(position = "top") +
       theme(axis.text.x=element_text(angle = 20, vjust = -.3, hjust=.1)) +
       stat_summary(fun.y=mean, geom="point", shape=4, size=4, col="black")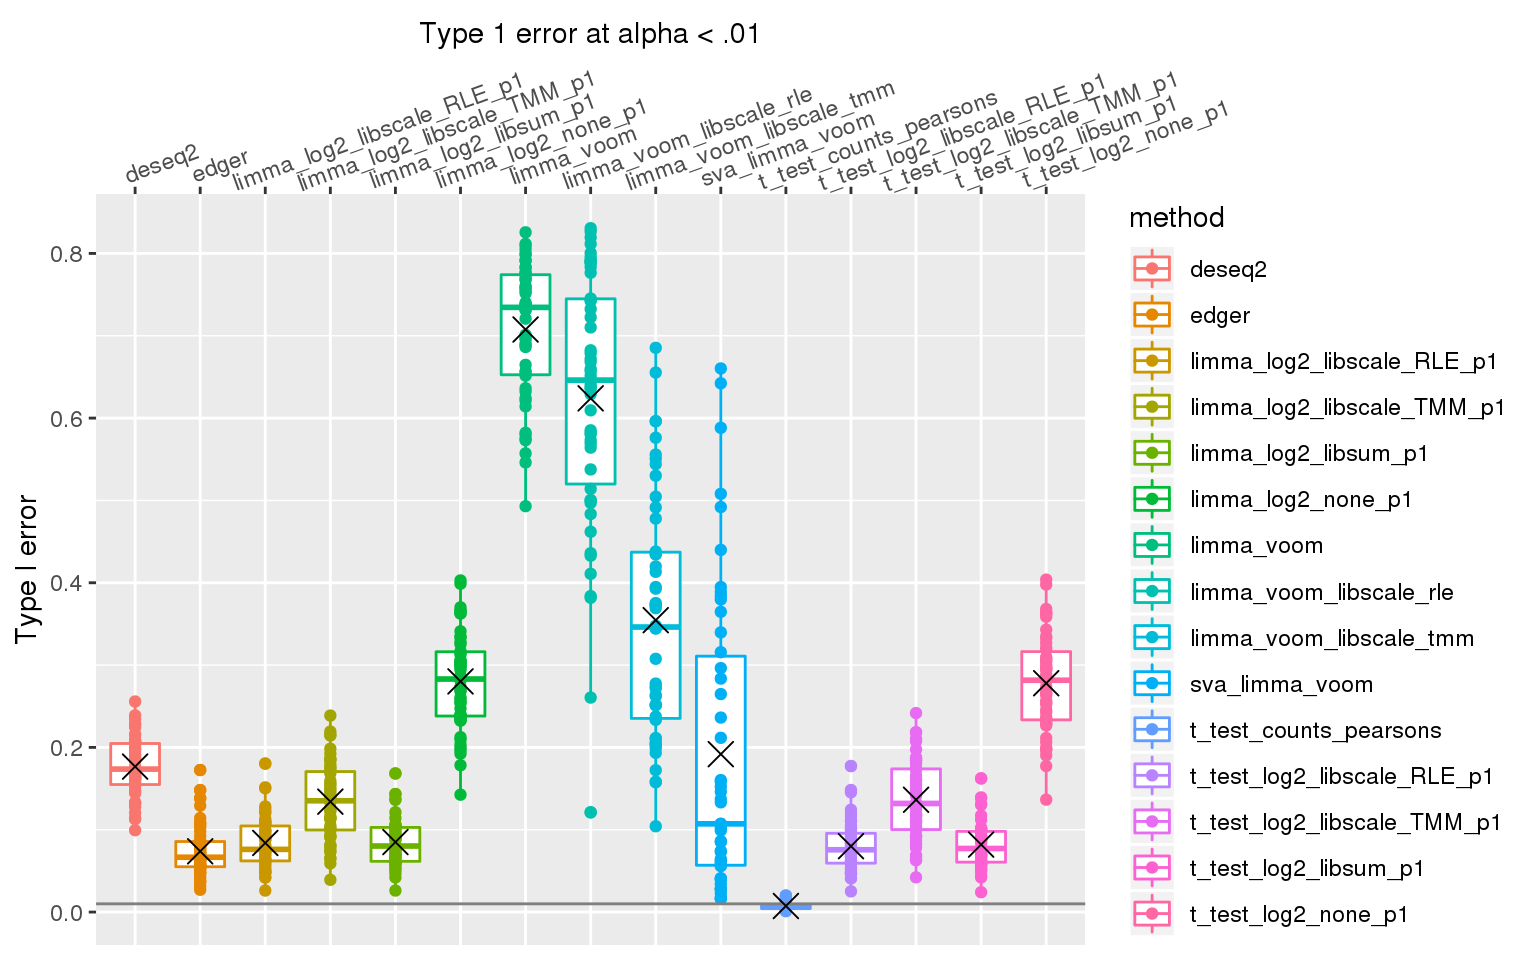
| Version | Author | Date |
|---|---|---|
| e6fb98b | Joyce Hsiao | 2019-05-10 |
out %>% #filter(n1==50) %>%
    group_by(nsim, method) %>%
    summarise(mse_mn =mean(mse, na.rm=T)) %>%
    ggplot(., aes(x=method, y=mse_mn, col=method)) +
#        facet_wrap(~de_method) +
        geom_boxplot() + geom_point() + xlab("Mean squared error") +
        ylab("Mean squared error") +
      scale_x_discrete(position = "top") +
       theme(axis.text.x=element_text(angle = 20, vjust = -.3, hjust=.1)) +
       stat_summary(fun.y=mean, geom="point", shape=4, size=4, col="black")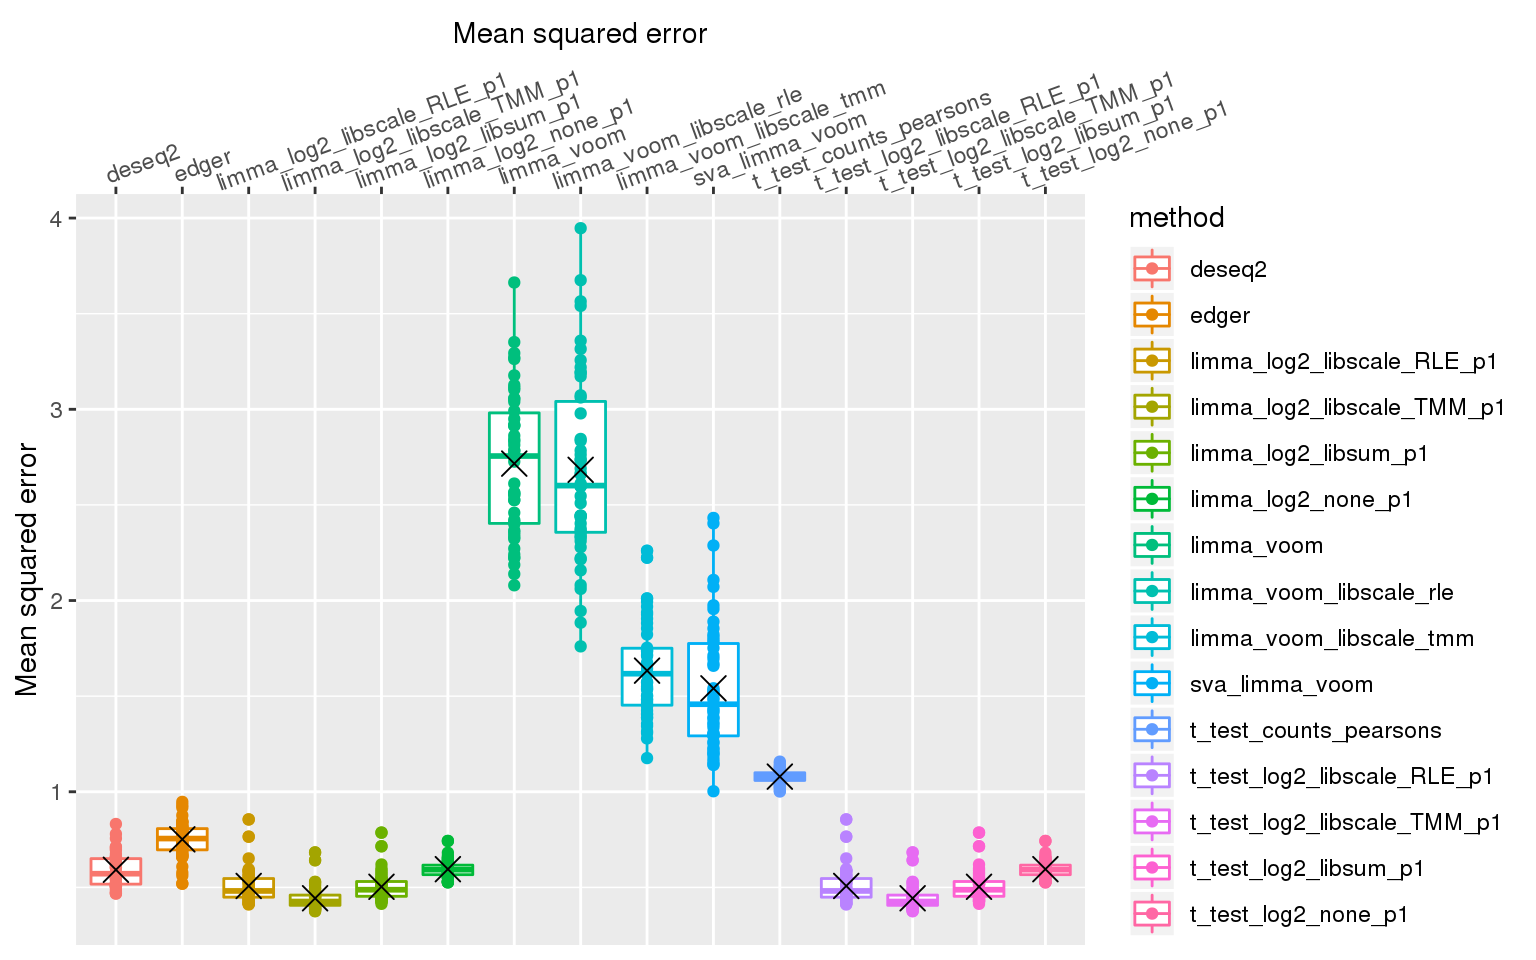
| Version | Author | Date |
|---|---|---|
| e6fb98b | Joyce Hsiao | 2019-05-10 |
library size factor 2
counts <- readRDS("dsc/data/pbmc_counts.rds")
nsamp <- 100
ngene <- 1000
prop_null <- 0
libsize_factor <- 2
signal_fun <- function(n) rep(libsize_factor, n)
signal_params <- list()
#pvals_thres <- .001
nsim <- 50
for (i in 1:nsim) {
  set.seed(i)
  data_obj <- poisthin(t(counts), nsamp=nsamp, ngene=ngene,
                       signal_params=signal_params, signal_fun=signal_fun,
                       prop_null = prop_null)
  saveRDS(data_obj, file = paste0("output/transform_null.Rmd/data_obj_libfactor_2_",i,".rds"))
}


nsim=50
out <- do.call(rbind, lapply(1:nsim, function(i) {
  print(i)
  data_obj <- readRDS(file = paste0("output/transform_null.Rmd/data_obj_libfactor_2_",
                                    i,".rds"))

  res <- run_methods(data_obj, i, verbose = T)
  return(res)
  }) )
out$method <- as.character(out$de_method)
which_relabel <- which(as.character(out$de_method) != as.character(out$transform_method))
out$method[which_relabel] <- paste(as.character(out$de_method), as.character(out$transform_method), sep="_")[which_relabel]
out$method <- factor(out$method)

saveRDS(out, file = "output/transform_null.Rmd/libfactor_2.rds")
Results
#alpha <- .001
out <- readRDS(file = "output/transform_null.Rmd/libfactor_2.rds")

levels(out$method)
[1] "deseq2" "edger"
[3] "limma_log2_libscale_RLE_p1" "limma_log2_libscale_TMM_p1"
[5] "limma_log2_libsum_p1" "limma_log2_none_p1"
[7] "limma_voom" "limma_voom_libscale_rle"
[9] "limma_voom_libscale_tmm" "sva_limma_voom"
[11] "t_test_counts_pearsons" "t_test_log2_libscale_RLE_p1"
[13] "t_test_log2_libscale_TMM_p1" "t_test_log2_libsum_p1"
[15] "t_test_log2_none_p1" out %>% #filter(n1==50) %>%
group_by(method) %>%
ggplot(., aes(x=method, y=type1error_001, col=method)) +
# facet_wrap(~de_method) +
geom_boxplot() + geom_point() + xlab("Type 1 error at alpha < .001") +
geom_hline(yintercept = .001, col="gray50") +
ylab("Type I error") +
scale_x_discrete(position = "top") +
theme(axis.text.x=element_text(angle = 20, vjust = -.3, hjust=.1)) +
stat_summary(fun.y=mean, geom="point", shape=4, size=4, col="black")Warning: Removed 3 rows containing non-finite values (stat_boxplot).Warning: Removed 3 rows containing non-finite values (stat_summary).Warning: Removed 3 rows containing missing values (geom_point).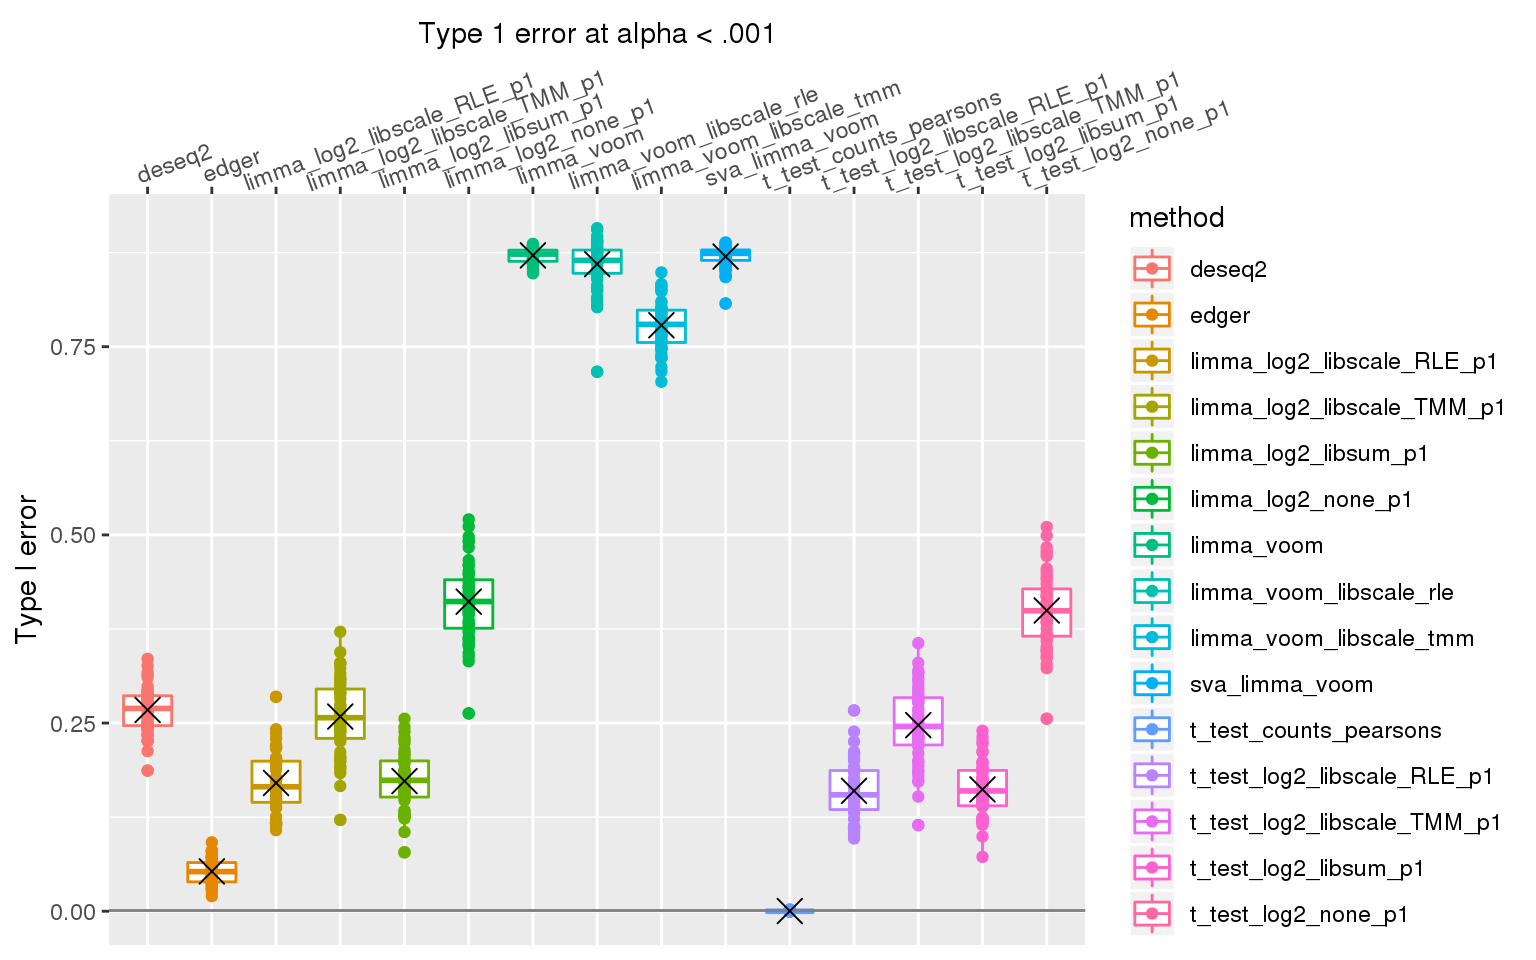
| Version | Author | Date |
|---|---|---|
| e6fb98b | Joyce Hsiao | 2019-05-10 |
out %>% #filter(n1==50) %>%
    group_by(method) %>%
    ggplot(., aes(x=method, y=type1error_01, col=method)) +
#        facet_wrap(~de_method) +
        geom_boxplot() + geom_point() + xlab("Type 1 error at alpha < .01") +
        geom_hline(yintercept = .01, col="gray50") +
        ylab("Type I error") +
      scale_x_discrete(position = "top") +
       theme(axis.text.x=element_text(angle = 20, vjust = -.3, hjust=.1)) +
       stat_summary(fun.y=mean, geom="point", shape=4, size=4, col="black")
Warning: Removed 3 rows containing non-finite values (stat_boxplot).Warning: Removed 3 rows containing non-finite values (stat_summary).Warning: Removed 3 rows containing missing values (geom_point).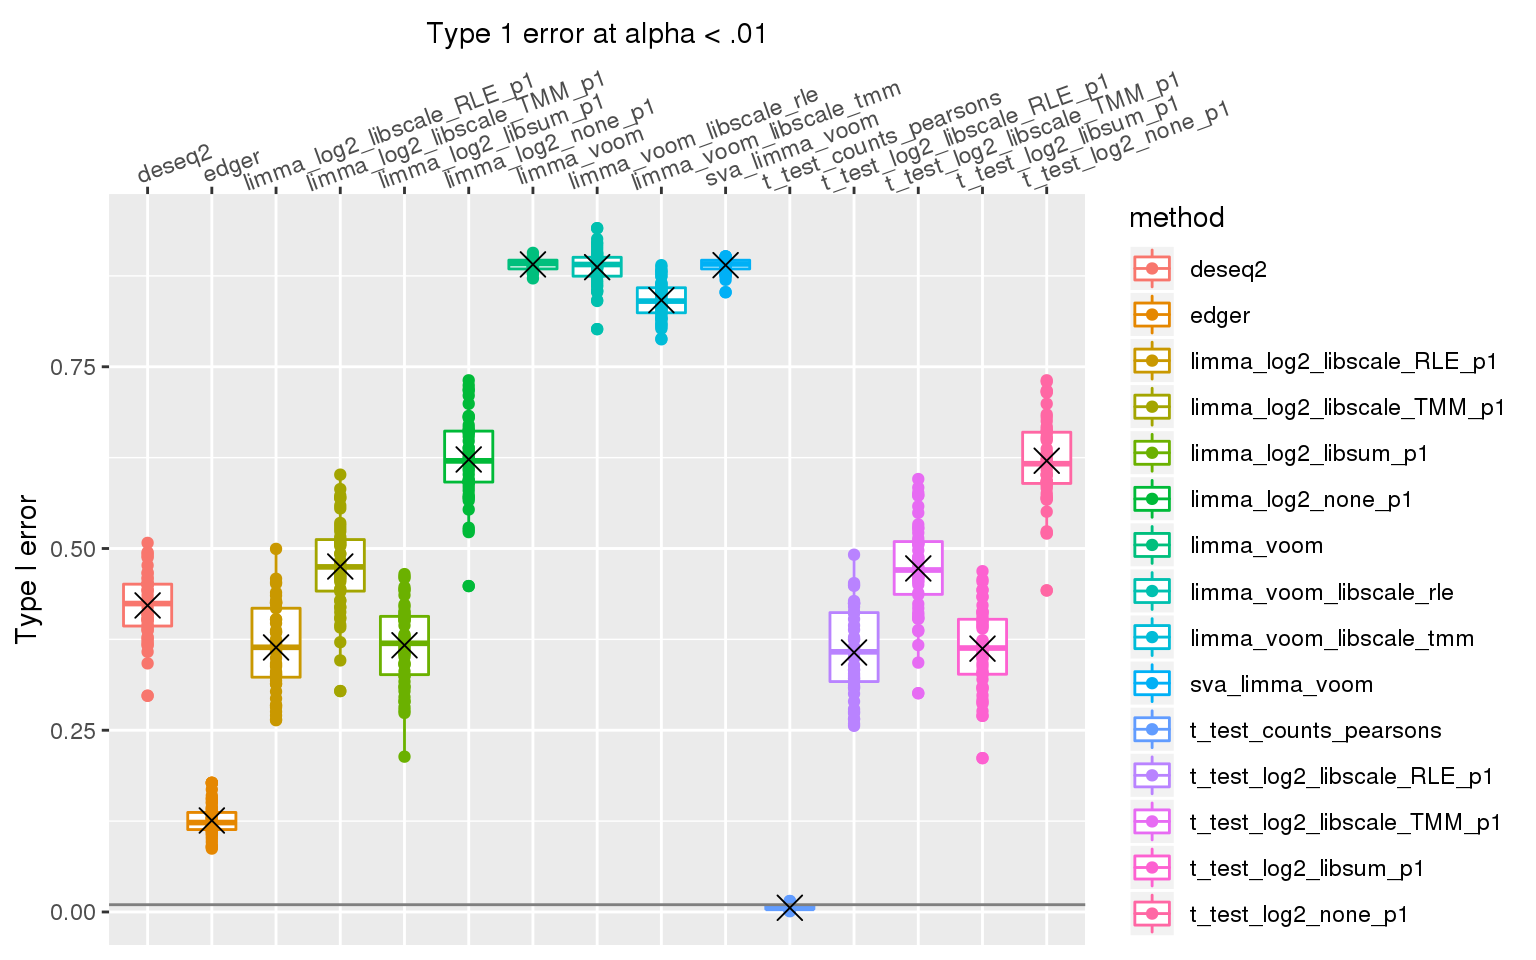
| Version | Author | Date |
|---|---|---|
| e6fb98b | Joyce Hsiao | 2019-05-10 |
out %>% #filter(n1==50) %>%
    group_by(nsim, method) %>%
    summarise(mse_mn =mean(mse, na.rm=T)) %>%
    ggplot(., aes(x=method, y=mse_mn, col=method)) +
#        facet_wrap(~de_method) +
        geom_boxplot() + geom_point() + xlab("Mean squared error") +
        ylab("Mean squared error") +
      scale_x_discrete(position = "top") +
       theme(axis.text.x=element_text(angle = 20, vjust = -.3, hjust=.1)) +
       stat_summary(fun.y=mean, geom="point", shape=4, size=4, col="black")
Warning: Removed 3 rows containing non-finite values (stat_boxplot).Warning: Removed 3 rows containing non-finite values (stat_summary).Warning: Removed 3 rows containing missing values (geom_point).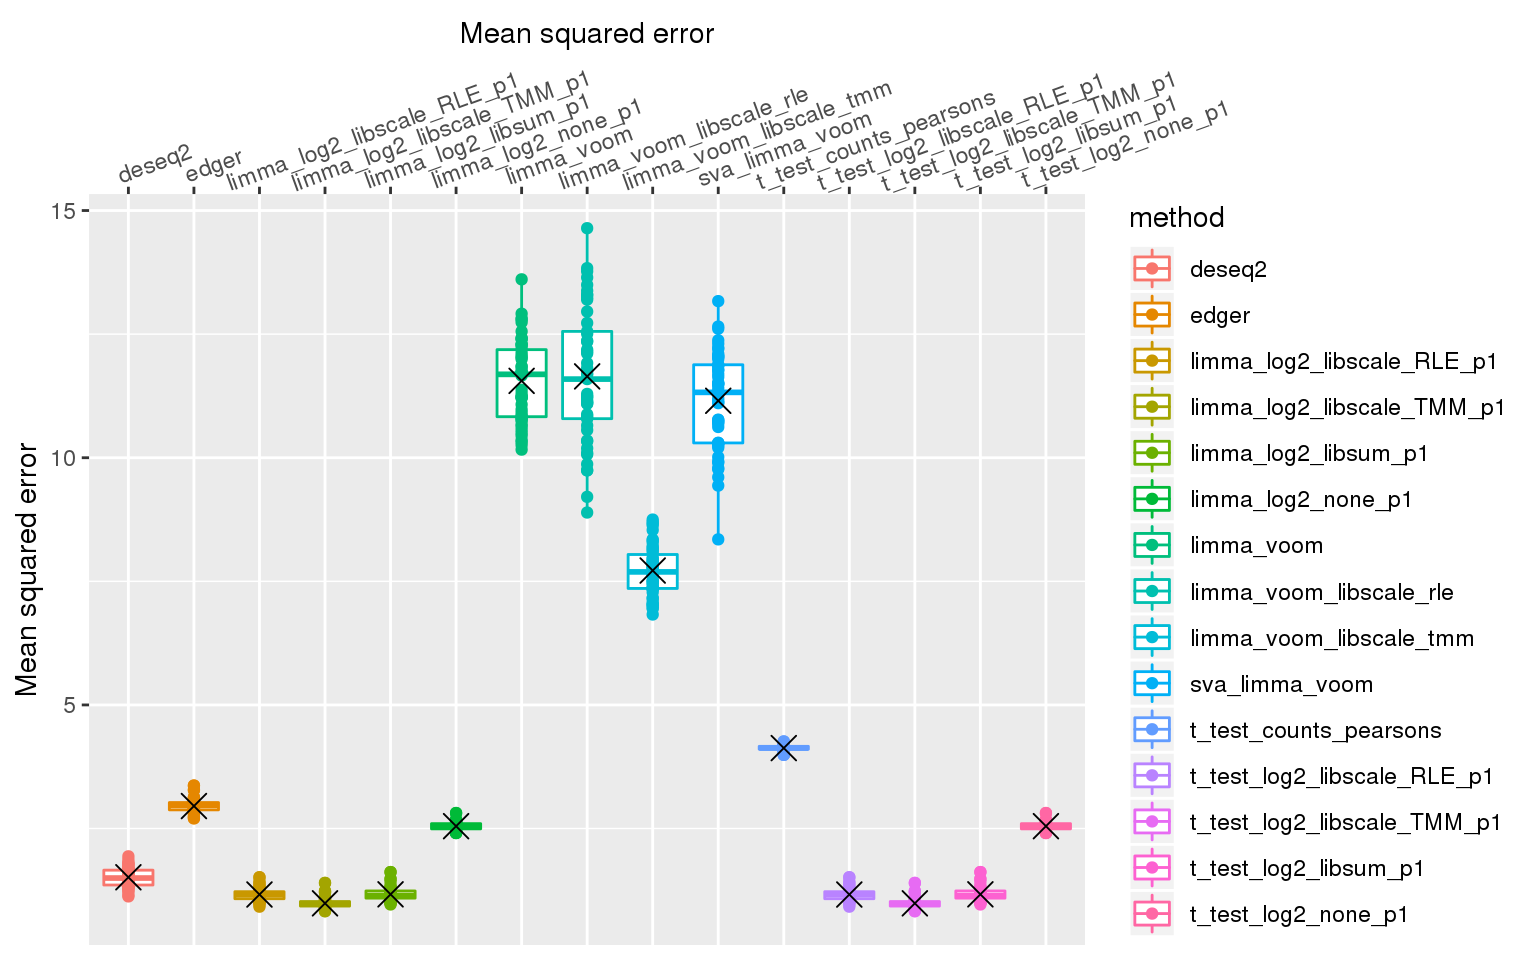
| Version | Author | Date |
|---|---|---|
| e6fb98b | Joyce Hsiao | 2019-05-10 |
TBD
res_libfactor_null <- readRDS(file = "output/transform_null.Rmd/type1error.rds")
res_libfactor_null$libfactor <- 2^0
res_libfactor_1 <- readRDS(file = "output/transform_null.Rmd/type1error_libfactor_1.rds")
res_libfactor_1$libfactor <- 2^1
res_libfactor_2 <- readRDS(file = "output/transform_null.Rmd/type1error_libfactor_2.rds")
res_libfactor_2$libfactor <- 2^2

res <- rbind(res_libfactor_null,
             res_libfactor_1)
res$libfactor <- factor(res$libfactor)


# res %>% #filter(n1==50) %>%
#     group_by(libfactor, transform_method) %>%
#     ggplot(., aes(x=transform_method, y=type1error_001, col=transform_method)) +
# #        facet_wrap(~libfactor) +
#         geom_boxplot() + geom_point() + xlab("Type 1 error at alpha < .001") +
#         geom_hline(yintercept = .001, col="gray50") +
#         ylab("Type I error") +
#       scale_x_discrete(position = "top",
#                        labels=labels_methods) +
#        theme(axis.text.x=element_text(angle = 20, vjust = -.3, hjust=.1)) +
#        stat_summary(fun.y=mean, geom="point", shape=4, size=4, col="black")
sessionInfo()R version 3.5.1 (2018-07-02)
Platform: x86_64-pc-linux-gnu (64-bit)
Running under: Scientific Linux 7.4 (Nitrogen)
Matrix products: default
BLAS/LAPACK: /software/openblas-0.2.19-el7-x86_64/lib/libopenblas_haswellp-r0.2.19.so
locale:
[1] LC_CTYPE=en_US.UTF-8 LC_NUMERIC=C
[3] LC_TIME=en_US.UTF-8 LC_COLLATE=en_US.UTF-8
[5] LC_MONETARY=en_US.UTF-8 LC_MESSAGES=en_US.UTF-8
[7] LC_PAPER=en_US.UTF-8 LC_NAME=C
[9] LC_ADDRESS=C LC_TELEPHONE=C
[11] LC_MEASUREMENT=en_US.UTF-8 LC_IDENTIFICATION=C
attached base packages:
[1] stats graphics grDevices utils datasets methods base
other attached packages:
[1] sctransform_0.2.0 seqgendiff_0.1.0 forcats_0.3.0
[4] stringr_1.3.1 dplyr_0.8.0.1 purrr_0.3.2
[7] readr_1.3.1 tidyr_0.8.3 tibble_2.1.1
[10] ggplot2_3.1.0 tidyverse_1.2.1
loaded via a namespace (and not attached):
[1] tidyselect_0.2.5 listenv_0.7.0 reshape2_1.4.3
[4] haven_1.1.2 lattice_0.20-38 colorspace_1.3-2
[7] generics_0.0.2 htmltools_0.3.6 yaml_2.2.0
[10] rlang_0.3.4 pillar_1.3.1 glue_1.3.0
[13] withr_2.1.2 modelr_0.1.2 readxl_1.1.0
[16] plyr_1.8.4 munsell_0.5.0 gtable_0.2.0
[19] workflowr_1.3.0 cellranger_1.1.0 rvest_0.3.2
[22] future_1.12.0 codetools_0.2-15 evaluate_0.12
[25] labeling_0.3 knitr_1.20 parallel_3.5.1
[28] broom_0.5.1 Rcpp_1.0.1 scales_1.0.0
[31] backports_1.1.2 jsonlite_1.6 fs_1.2.6
[34] gridExtra_2.3 hms_0.4.2 digest_0.6.18
[37] stringi_1.2.4 grid_3.5.1 rprojroot_1.3-2
[40] cli_1.0.1 tools_3.5.1 magrittr_1.5
[43] lazyeval_0.2.1 crayon_1.3.4 whisker_0.3-2
[46] future.apply_1.2.0 pkgconfig_2.0.2 MASS_7.3-51.1
[49] Matrix_1.2-17 xml2_1.2.0 lubridate_1.7.4
[52] assertthat_0.2.0 rmarkdown_1.10 httr_1.3.1
[55] rstudioapi_0.10 globals_0.12.4 R6_2.4.0
[58] nlme_3.1-137 git2r_0.23.0 compiler_3.5.1