Method eval applying to bulk RNA-seq: type I error
Joyce Hsiao
2019-04-29
Last updated: 2019-05-01
Checks: 6 0
Knit directory: dsc-log-fold-change/
This reproducible R Markdown analysis was created with workflowr (version 1.3.0). The Checks tab describes the reproducibility checks that were applied when the results were created. The Past versions tab lists the development history.
Great! Since the R Markdown file has been committed to the Git repository, you know the exact version of the code that produced these results.
Great job! The global environment was empty. Objects defined in the global environment can affect the analysis in your R Markdown file in unknown ways. For reproduciblity it’s best to always run the code in an empty environment.
The command set.seed(20181115) was run prior to running the code in the R Markdown file. Setting a seed ensures that any results that rely on randomness, e.g. subsampling or permutations, are reproducible.
Great job! Recording the operating system, R version, and package versions is critical for reproducibility.
Nice! There were no cached chunks for this analysis, so you can be confident that you successfully produced the results during this run.
Great! You are using Git for version control. Tracking code development and connecting the code version to the results is critical for reproducibility. The version displayed above was the version of the Git repository at the time these results were generated.
Note that you need to be careful to ensure that all relevant files for the analysis have been committed to Git prior to generating the results (you can use wflow_publish or wflow_git_commit). workflowr only checks the R Markdown file, but you know if there are other scripts or data files that it depends on. Below is the status of the Git repository when the results were generated:
Ignored files:
    Ignored:    .Rhistory
    Ignored:    .Rproj.user/
    Ignored:    .sos/
    Ignored:    analysis/.sos/
    Ignored:    dsc/.sos/
    Ignored:    dsc/benchmark/
    Ignored:    dsc/dsc_test/.sos/
    Ignored:    output/

Untracked files:
    Untracked:  analysis/eval_initial_type1_libsize.Rmd
    Untracked:  dsc/modules/filter_genes.R

Unstaged changes:
    Modified:   analysis/index.Rmd
    Modified:   dsc/benchmark.dsc
    Modified:   dsc/benchmark.sh
    Deleted:    dsc/modules/filter_gene.R
Note that any generated files, e.g. HTML, png, CSS, etc., are not included in this status report because it is ok for generated content to have uncommitted changes.
There are no past versions. Publish this analysis with wflow_publish() to start tracking its development.
Introduction
Evaluate type I error of some DE methods, using default normalization and filtering steps: edger, deseq2, limma_voom, t_test + input log2(Y+1), t_test + input log2CPM expression data quantiled normalized per gene, wilcoxon + input count data
Assume equal library size for all samples
Experimental data: GTEx V6 lung tissue, 320 samples and 16,069 genes.
- Simulation parameters
- number of genes: 1,000 randomly sampled from experimental data
- number of samples per group: (5,5), (10,10), (50,50), (150,150); draw n1+n2 from experimental data, then randomly assigned to group 1 or group 2
- fraction of true effects: 0
- distribution of true effects: normal distribution with mean 0 and sd 1
Extract dsc results
knitr::opts_chunk$set(warning=F, message=F)

library(dscrutils)
library(tidyverse)
── Attaching packages ──────────────────────────────────────────────────── tidyverse 1.2.1 ──✔ ggplot2 3.1.0 ✔ purrr 0.3.2
✔ tibble 2.1.1 ✔ dplyr 0.8.0.1
✔ tidyr 0.8.3 ✔ stringr 1.3.1
✔ readr 1.3.1 ✔ forcats 0.3.0 ── Conflicts ─────────────────────────────────────────────────────── tidyverse_conflicts() ──
✖ dplyr::filter() masks stats::filter()
✖ dplyr::lag() masks stats::lag()extract dsc output and get p-values, q-values, true signals, etc.
dir_dsc <- "/scratch/midway2/joycehsiao/dsc-log-fold-change/pipe_gtex"

dsc_res <- dscquery(dir_dsc,
                    targets=c("data_poisthin_gtex",
                              "data_poisthin_gtex.seed",
                              "data_poisthin_gtex.n1",
                              "data_poisthin_gtex.prop_null",
                              "method", "pval_rank"),
                    ignore.missing.file = T)

method_vec <- as.factor(dsc_res$method)
n_methods <- nlevels(method_vec)
dsc_res <- dsc_res[dsc_res$method != "sva_limma_voom" & dsc_res$method != "sva_ttest",]
res <- list()
for (i in 1:nrow(dsc_res)) {
  print(i)
  fl_pval <- readRDS(file.path(dir_dsc,
                       paste0(as.character(dsc_res$method.output.file[i]), ".rds")))
  fl_beta <- readRDS(file.path(dir_dsc,
                    paste0(as.character(dsc_res$data_poisthin_gtex.output.file[i]), ".rds")))
  prop_null <- dsc_res$data_poisthin_gtex.prop_null[i]
  seed <- dsc_res$data_poisthin_gtex.seed[i]
  n1 <- dsc_res$data_poisthin_gtex.n1[i]
  # fl_qval <- readRDS(file.path(dir_dsc,
  #                    paste0(as.character(dsc_res$pval_rank.output.file[i]), ".rds")))
  res[[i]] <- data.frame(method = as.character(dsc_res$method)[i],
                         seed = seed,
                         n1=n1,
                         prop_null=prop_null,
                         pval = fl_pval$pval,
                         true_vec = fl_beta$beta != 0,
                         stringsAsFactors = F)
}
res_merge <- do.call(rbind, res)

saveRDS(res_merge, file = "output/gtex_type1.Rmd/res_merge.rds")
Analysis
res_merge <- readRDS(file = "output/gtex_type1.Rmd/res_merge.rds")

make_plots <- function(res, alpha, labels,
                       args=list(n1, labels)) {
  n_methods <- length(unique(res$method))
  cols <- RColorBrewer::brewer.pal(n_methods,name="Dark2")
  res %>% filter(n1==args$n1) %>%
    group_by(method, seed) %>%
    summarise(type1=mean(pval<alpha, na.rm=T), nvalid=sum(!is.na(pval))) %>%
    ggplot(., aes(x=method, y=type1, col=method)) +
        # geom_errorbar(aes(ymin=mn+se, ymax=mn-se), width=.3) +
        geom_boxplot() + geom_point(size=.7) + xlab("") +
      ylab("Type I error") +
      scale_x_discrete(position = "top",
                       labels=args$labels) +
      scale_color_manual(values=cols) +
      theme(axis.text.x=element_text(angle = 20, vjust = -.3, hjust=-.1))
}

library(cowplot)
levels(factor(res_merge$method))
[1] "deseq2" "edger" "limma_voom"
[4] "t_test" "t_test_log2cpm_quant" "wilcoxon" labels <- c("deseq2", "edger", "limma_v", "sva_ttest", "t_test", "t_test_log2cpm_q", "wilcoxon")
make_plots(subset(res_merge, prop_null==1), alpha=.001,
args=list(n1=50, labels=labels)) +
ggtitle("Type error at alpha < .001, 50/group") +
geom_hline(yintercept=.001, col="gray30", lty=3) +
stat_summary(fun.y=median, geom="point", shape=18, size=6, col="black") +
stat_summary(fun.y=mean, geom="point", shape=4, size=4, col="black")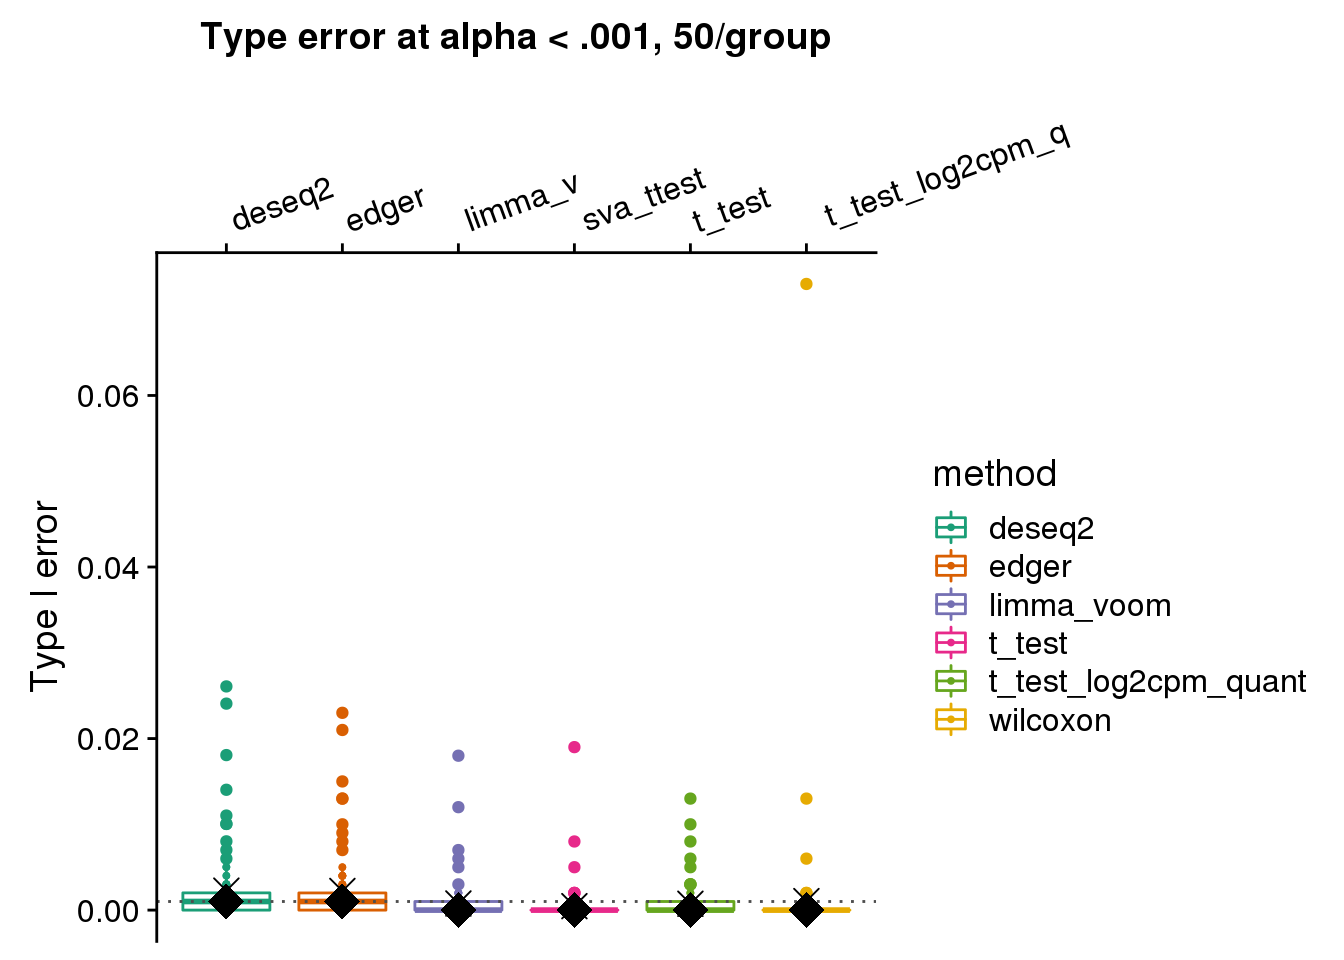
wilcoxon type I error is ~.06 for one dataset, and the corresponding type I error of t-test is ~.01, but for limma_voom is .001. Below I go over this null dataset. For 54 genes in this null dataset, wilcoxon test returned a smaller p-value than t-test. I investigated possible explanations for this, such as number of tied values and mean-variance relationship. But haven’t reached a clear idea of why this may be the case?
# strange outlier
res <- subset(res_merge, prop_null==1);alpha=.001;args=list(n1=50)
out <- res %>% filter(n1==args$n1) %>%
  group_by(method, seed) %>%
  summarise(type1=mean(pval<alpha, na.rm=T), nvalid=sum(!is.na(pval)))
out[which(out$type1 > .06),]

oo <- subset(res_merge, prop_null==1 & seed==93 & n1==50)
oo %>% group_by(method) %>%
  summarise(type1=mean(pval<alpha, na.rm=T), nvalid=sum(!is.na(pval)))
methods_vec <- unique(oo$method)
oo_print <- lapply(1:length(methods_vec), function(i) {
  which(oo[oo$method == methods_vec[i],]$pval < .001)
})
names(oo_print) <- methods_vec

# all sig. in wilcoxn also sig in t.test
setdiff(oo_print$t_test, oo_print$wilcoxon)

# genes sig. in wilcox but not in t.test
setdiff(oo_print$wilcoxon, oo_print$t_test)

# get the expression file
ff <- subset(dsc_res, method=="wilcoxon" & data_poisthin_gtex.prop_null==1 & data_poisthin_gtex.seed==93 & data_poisthin_gtex.n1==50)

df <- readRDS(file.path(dir_dsc,
                        paste0(ff$data_poisthin_gtex.output.file, ".rds")))
check_genes <- setdiff(oo_print$wilcoxon, oo_print$t_test)

do.call(rbind, lapply(1:length(check_genes), function(i) {
  list(pval_wil=wilcox.test(df$Y[check_genes[i],]~df$X[,2], correct=T)$p.value,
       pval_t=t.test(log2(df$Y[check_genes[i],]+1)~df$X[,2])$p.value) } ) )

# check if the issue is related to ties in count data
# no...
dd <- sapply(1:nrow(df$Y), function(i) sum(duplicated(df$Y[i,])))
table(dd[oo_print$wilcoxon])

# check if the issue is related to mean-variance dependency
col_vec <- rep("black", nrow(df$Y))
col_vec[check_genes] <- "red"
v <- voom(df$Y, design=df$X, plot=T, save.plot = T)
plot(x=v$voom.xy$x,y=v$voom.xy$y,col=col_vec)
log2 scale by method by sample size
make_plots_log2 <- function(res, alpha, labels,
                       args=list(n1, labels)) {
  n_methods <- length(unique(res$method))
  cols <- RColorBrewer::brewer.pal(n_methods,name="Dark2")
  res_plot <- res %>% filter(n1==args$n1) %>%
    group_by(method, seed) %>%
    summarise(type1=mean(pval<alpha, na.rm=T), nvalid=sum(!is.na(pval)))

  res_plot_mn <- res_plot %>% group_by(method) %>%
    summarise(mn=mean(type1, na.rm=T),
              med=median(type1, na.rm=T))
    # summarise(mn=mean(type1, na.rm=T),
    #           n=sum(!is.na(type1)), se=sd(type1, na.rm=T)/sqrt(n)) %>%
    ggplot(data=res_plot, aes(x=method, y=log2(type1), col=method)) +
        # geom_errorbar(aes(ymin=mn+se, ymax=mn-se), width=.3) +
        #geom_boxplot() +
      geom_point(size=.7) + xlab("") +
      scale_x_discrete(position = "top",
                       labels=args$labels) +
      scale_color_manual(values=cols) +
      theme(axis.text.x=element_text(angle = 20, vjust = -.3, hjust=-.1)) +
        geom_point(data=res_plot_mn,
                   aes(x=method, y=log2(mn)), shape=4, size=4, col="black") +
        geom_point(data=res_plot_mn,
                   aes(x=method, y=log2(med)), shape=18, size=6, col="black")
}

library(cowplot)
levels(factor(res_merge$method))
[1] "deseq2" "edger" "limma_voom"
[4] "t_test" "t_test_log2cpm_quant" "wilcoxon" labels <- c("deseq2", "edger", "limma_v", "sva_ttest", "t_test", "t_log2cpm_q", "wilcoxon")
make_plots_log2(subset(res_merge, prop_null==1), alpha=.001,
args=list(n1=5, labels=labels)) +
ggtitle("Type I error at alpha < .001, 5/group") + ylim(-11,-3) +
geom_hline(yintercept=log2(.001), col="gray30", lty=3) +
ylab("log2 type I error") 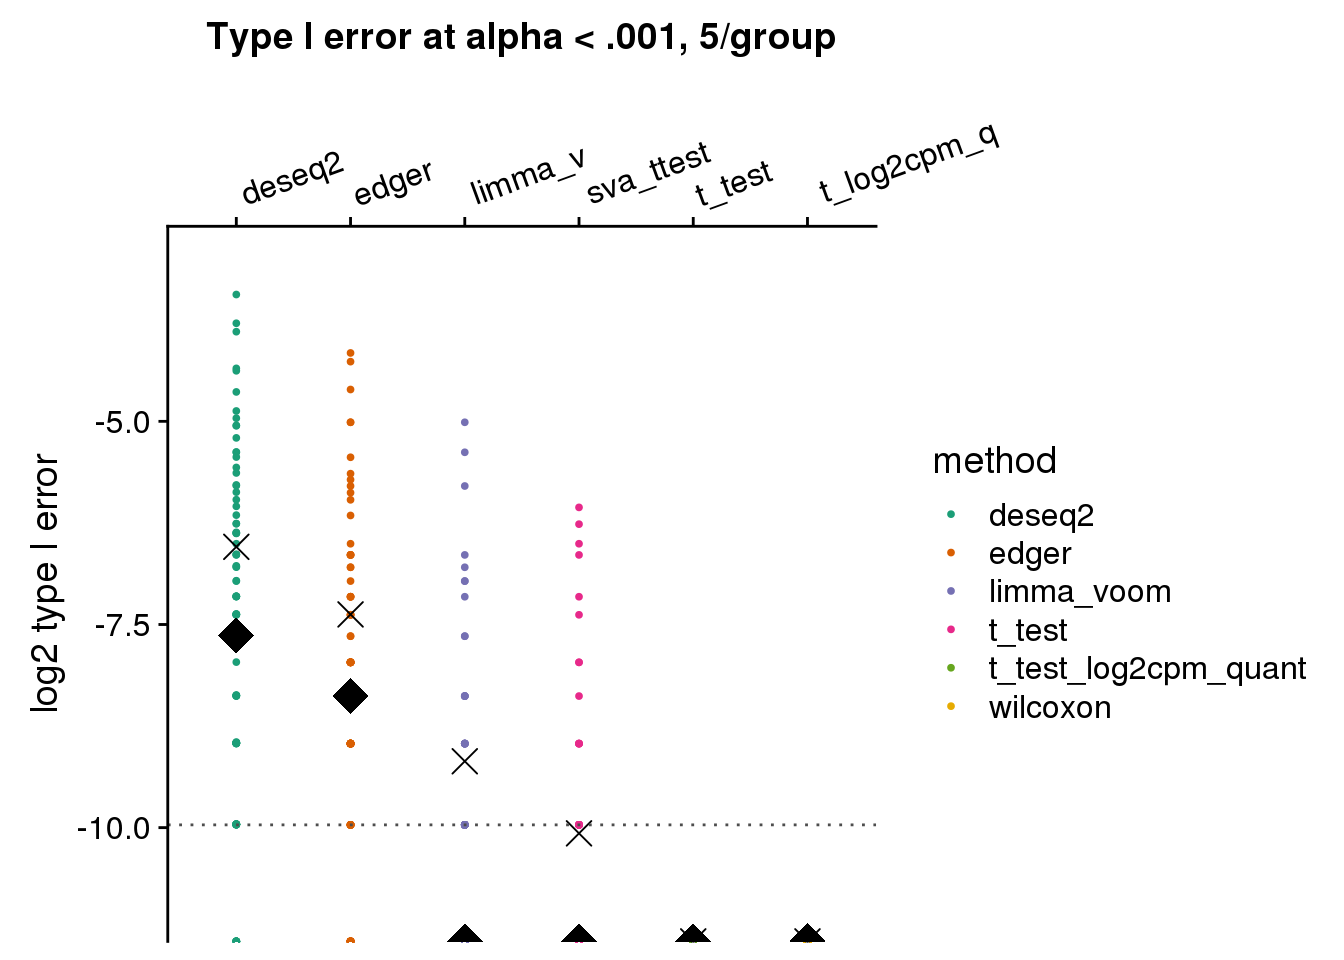
make_plots_log2(subset(res_merge, prop_null==1), alpha=.001,
                 args=list(n1=10, labels=labels)) +
                ggtitle("Type I error at alpha < .001, 10/group") + ylim(-11,-3) +
                geom_hline(yintercept=log2(.001), col="gray30", lty=3) +
ylab("log2 type I error") 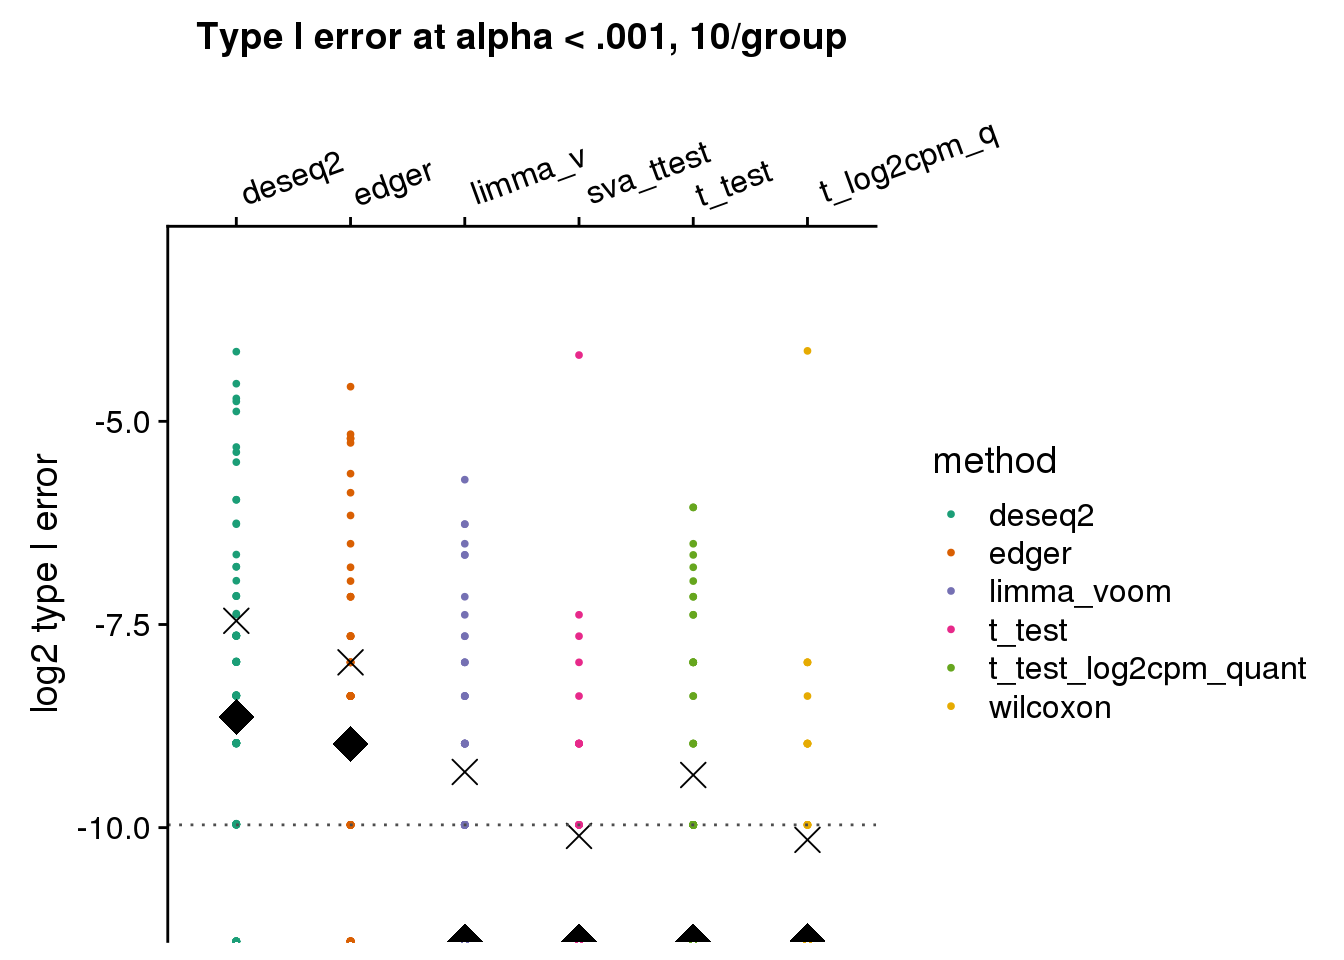
make_plots_log2(subset(res_merge, prop_null==1), alpha=.001,
                 args=list(n1=50, labels=labels)) +
                ggtitle("Type I error at alpha < .001, 50/group") + ylim(-11,-3) +
                geom_hline(yintercept=log2(.001), col="gray30", lty=3) +
ylab("log2 type I error") 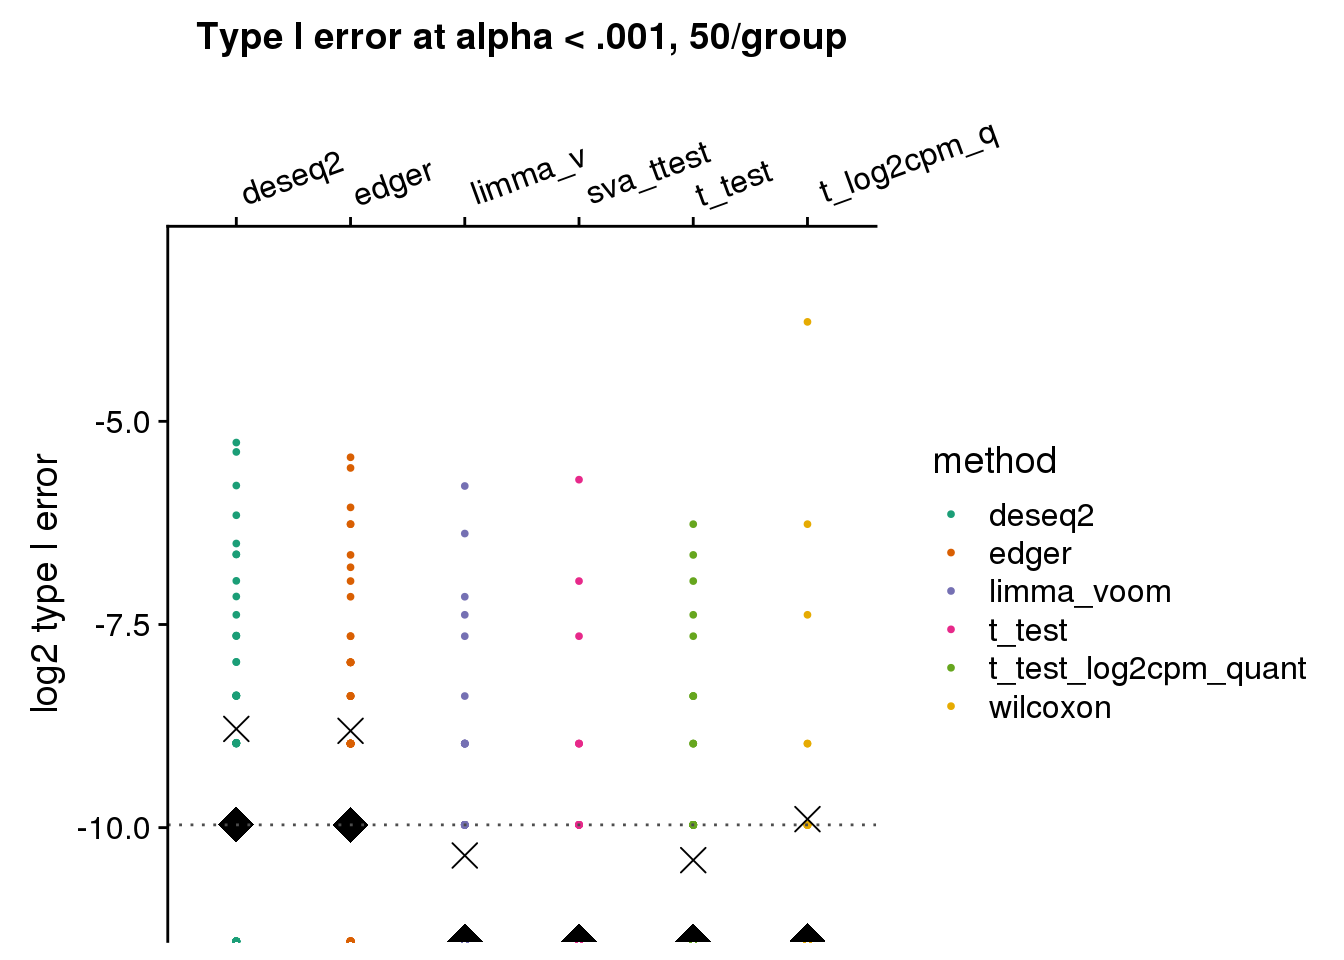
make_plots_log2(subset(res_merge, prop_null==1), alpha=.001,
                 args=list(n1=150, labels=labels)) +
                ggtitle("Type I error at alpha < .001, 150/group") + ylim(-11,-3) +
                geom_hline(yintercept=log2(.001), col="gray30", lty=3) +
ylab("log2 type I error") 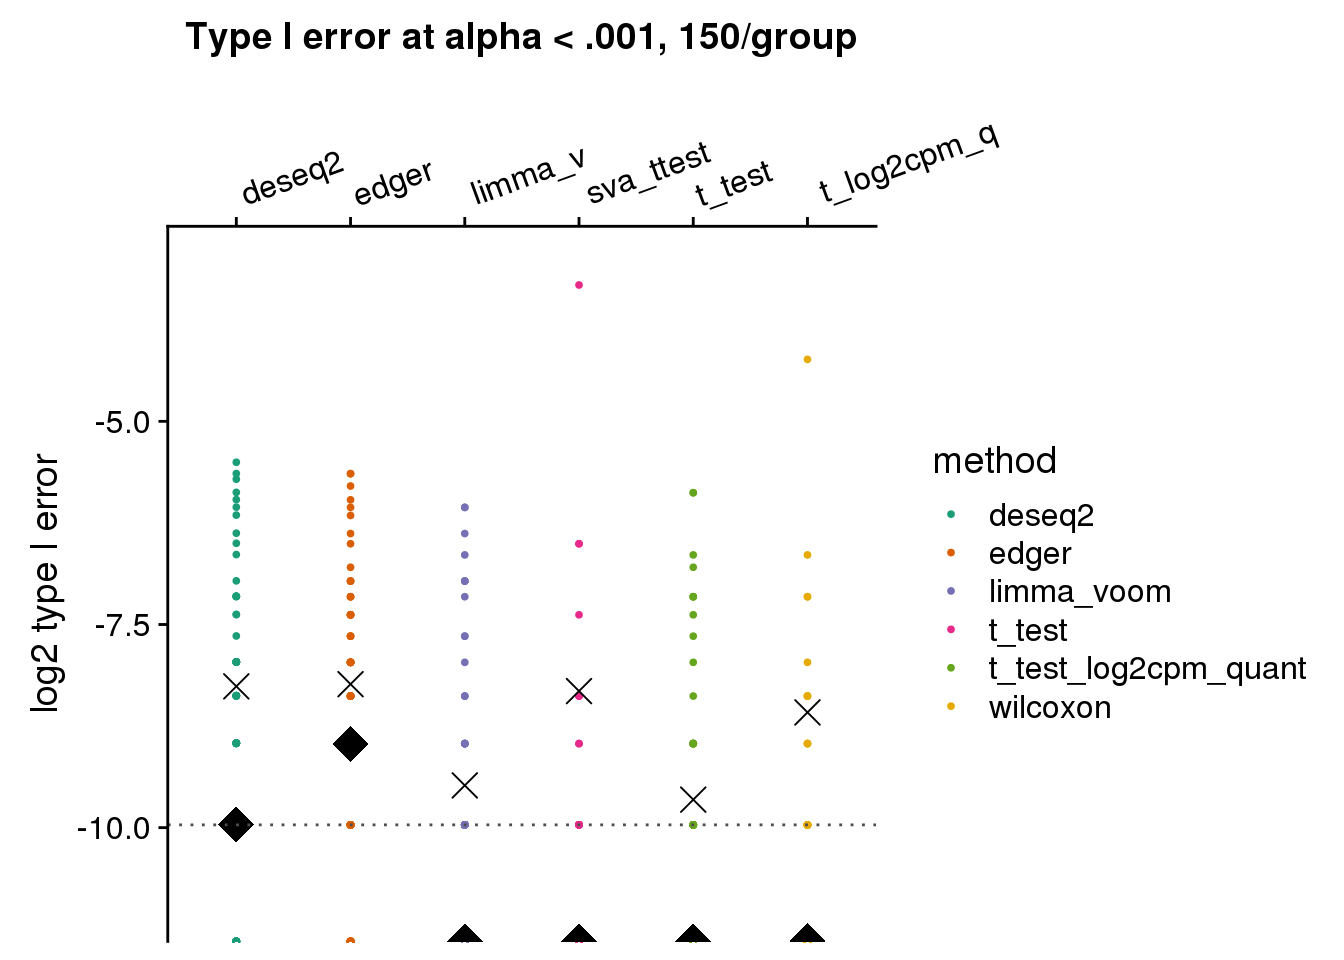
log2 scale by sample size by method
make_plots_log2_v2 <- function(res, alpha) {
  n_methods <- length(unique(res$method))
  cols <- RColorBrewer::brewer.pal(n_methods,name="Dark2")
  res_plot <- res %>% #filter(n1==args$n1) %>%
    group_by(n1, method, seed) %>%
    summarise(type1=mean(pval<alpha, na.rm=T), nvalid=sum(!is.na(pval)))
  res_plot$n1 <- factor(res_plot$n1)

  res_plot_mn <- res_plot %>% group_by(n1, method) %>%
    summarise(mn=mean(type1, na.rm=T),
              med=median(type1, na.rm=T))

  ggplot(data=res_plot, aes(x=n1, y=log2(type1), col=method)) +
    geom_point(size=.7) +
    facet_wrap(~method) +
    geom_point(data=res_plot_mn,
         aes(x=n1, y=log2(mn)), shape=4, size=3, col="black") +
    geom_point(data=res_plot_mn,
         aes(x=n1, y=log2(med)), shape=18, size=3, col="black") + #+ xlab("") +
    scale_color_manual(values=cols) +
    geom_hline(yintercept=log2(.001), col="gray30", lty=3)  +
    ylab("log2 Type I error") + xlab("sample size/group")
}

# library(cowplot)
# levels(factor(res_merge$method))
# labels <- c("deseq2", "edger", "limma_v", "t_test", "t_log2cpm_q", "wilcoxon")

make_plots_log2_v2(subset(res_merge, prop_null==1), alpha=.001) +
                ggtitle("Type I error at alpha < .001") + ylim(-12,-3)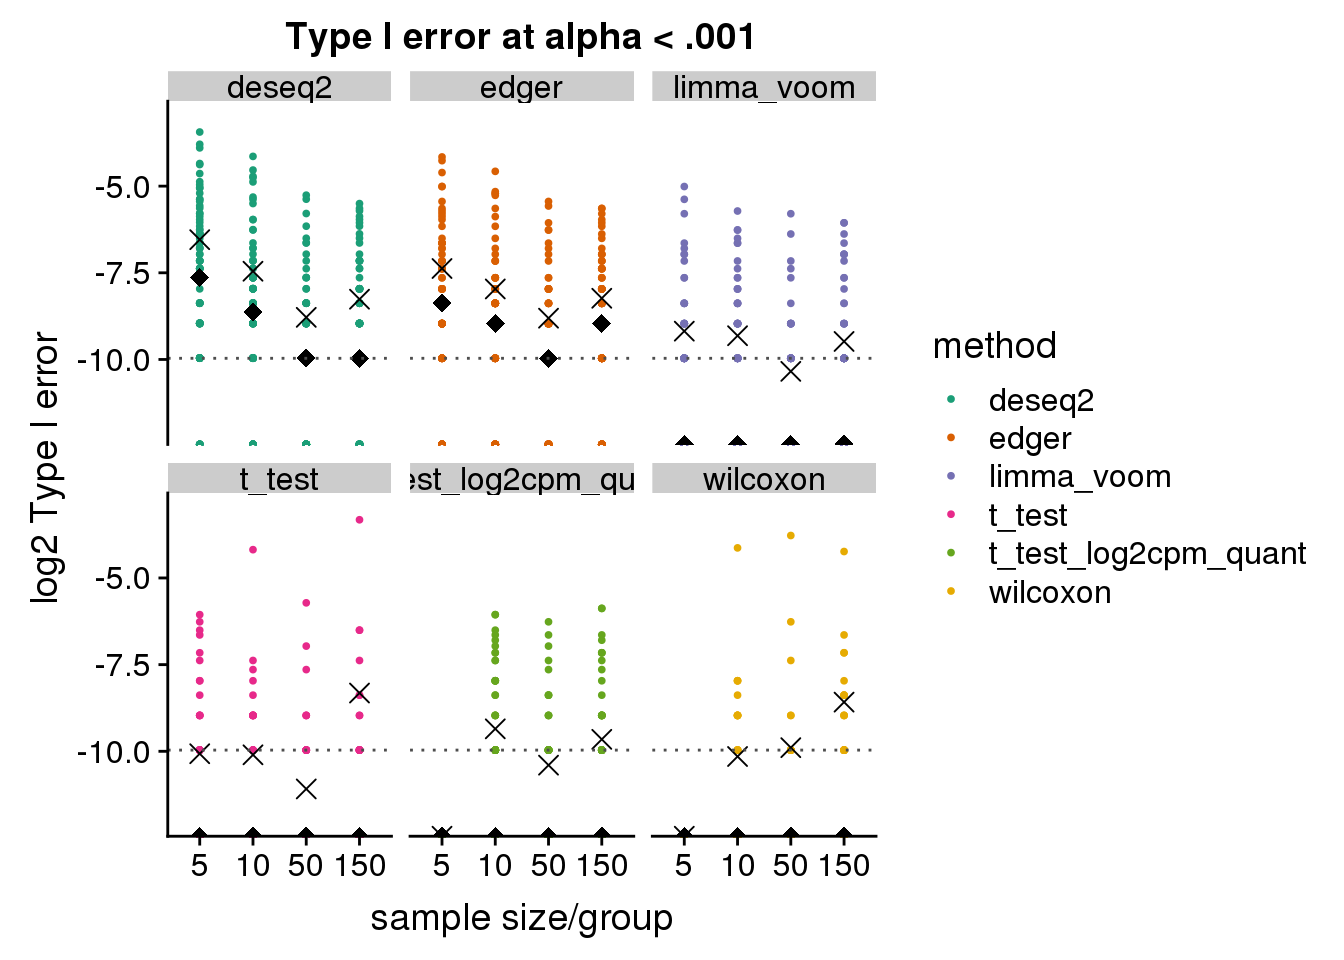
histogram of unadjusted p-value of one dataset
tmp <- subset(res_merge, prop_null==1 & n1==150) %>%
  group_by(seed, method) %>%
  summarise(type1=mean(pval < .001, na.rm=T))
tmp[which.max(tmp$type1),]
# A tibble: 1 x 3
# Groups: seed [1]
seed method type1
<int> <chr> <dbl>
1 89 t_test 0.165tmp[tmp$seed==89,]# A tibble: 6 x 3
# Groups: seed [1]
seed method type1
<int> <chr> <dbl>
1 89 deseq2 0.00402
2 89 edger 0.004
3 89 limma_voom 0.001
4 89 t_test 0.165
5 89 t_test_log2cpm_quant 0.002
6 89 wilcoxon 0.154 subset(res_merge, prop_null==1 & n1==50 & seed==89) %>%
ggplot(., aes(x=pval)) +
geom_histogram(bins=30) +
facet_wrap(~method)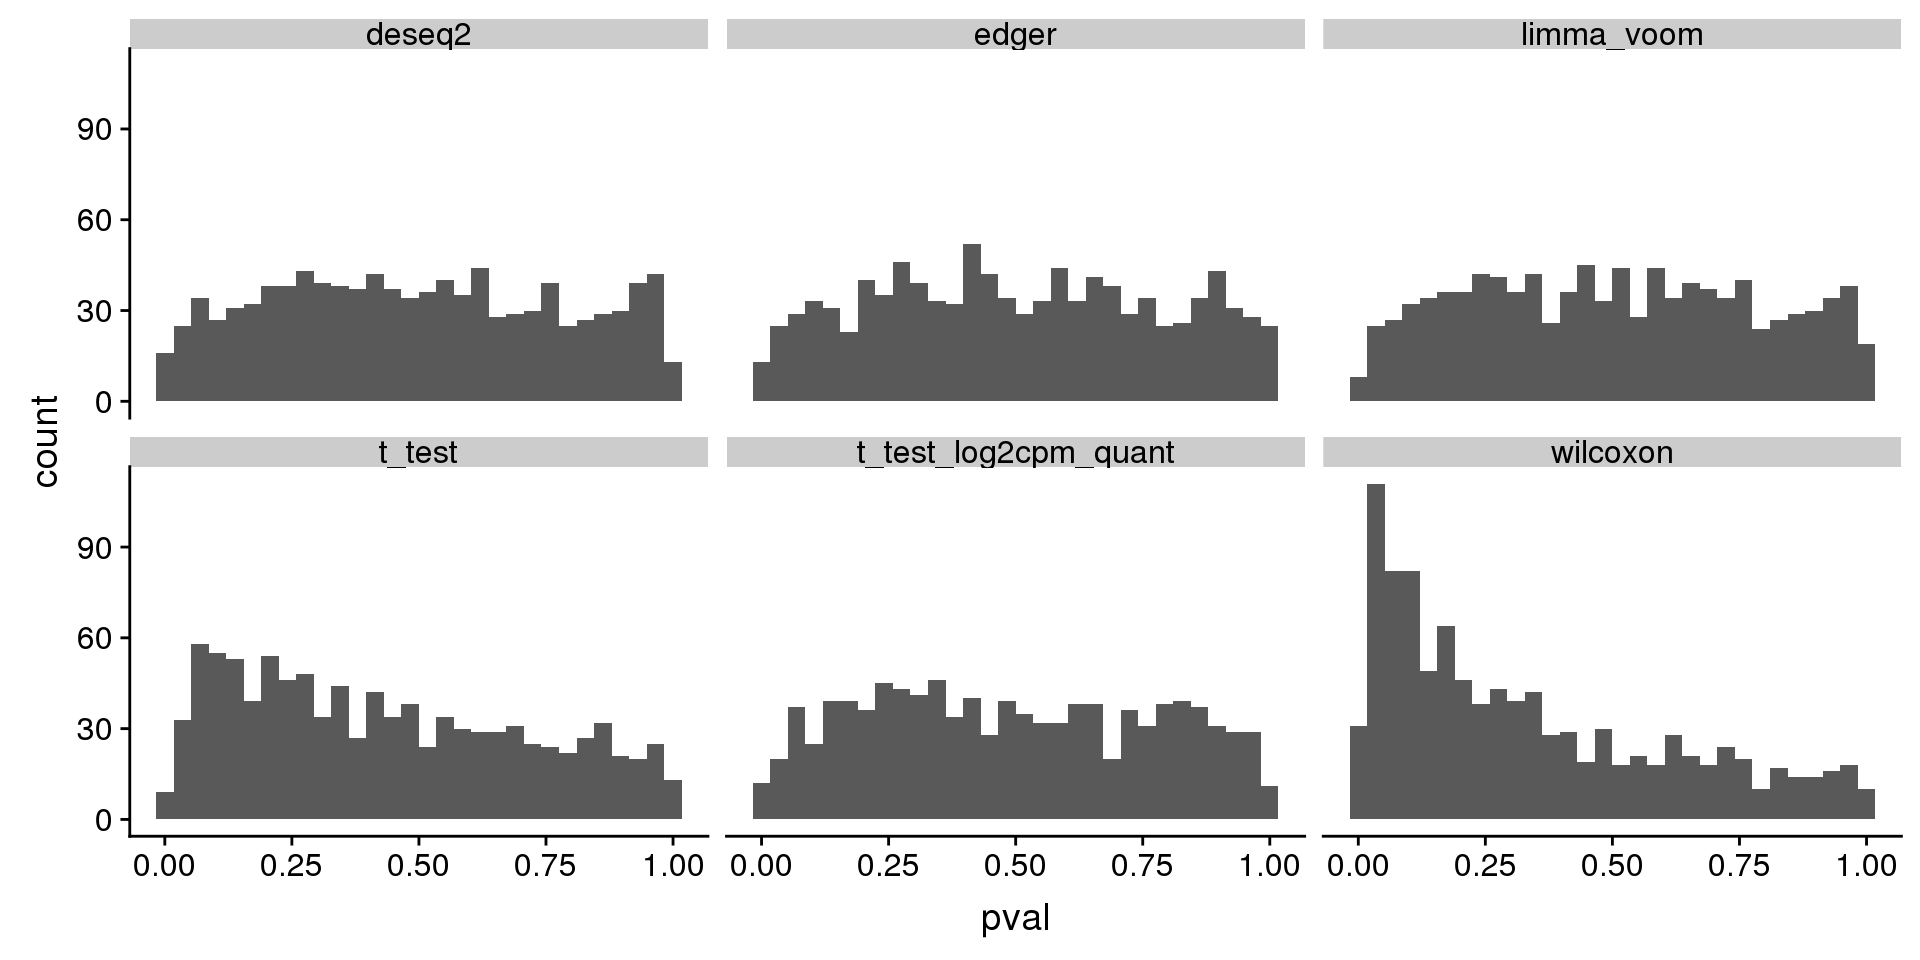
sessionInfo()R version 3.5.1 (2018-07-02)
Platform: x86_64-pc-linux-gnu (64-bit)
Running under: Scientific Linux 7.4 (Nitrogen)
Matrix products: default
BLAS/LAPACK: /software/openblas-0.2.19-el7-x86_64/lib/libopenblas_haswellp-r0.2.19.so
locale:
[1] LC_CTYPE=en_US.UTF-8 LC_NUMERIC=C
[3] LC_TIME=en_US.UTF-8 LC_COLLATE=en_US.UTF-8
[5] LC_MONETARY=en_US.UTF-8 LC_MESSAGES=en_US.UTF-8
[7] LC_PAPER=en_US.UTF-8 LC_NAME=C
[9] LC_ADDRESS=C LC_TELEPHONE=C
[11] LC_MEASUREMENT=en_US.UTF-8 LC_IDENTIFICATION=C
attached base packages:
[1] stats graphics grDevices utils datasets methods base
other attached packages:
[1] cowplot_0.9.4 forcats_0.3.0 stringr_1.3.1 dplyr_0.8.0.1
[5] purrr_0.3.2 readr_1.3.1 tidyr_0.8.3 tibble_2.1.1
[9] ggplot2_3.1.0 tidyverse_1.2.1 dscrutils_0.3.8
loaded via a namespace (and not attached):
[1] Rcpp_1.0.1 RColorBrewer_1.1-2 cellranger_1.1.0
[4] pillar_1.3.1 compiler_3.5.1 git2r_0.23.0
[7] plyr_1.8.4 workflowr_1.3.0 tools_3.5.1
[10] digest_0.6.18 lubridate_1.7.4 jsonlite_1.6
[13] evaluate_0.12 nlme_3.1-137 gtable_0.2.0
[16] lattice_0.20-38 pkgconfig_2.0.2 rlang_0.3.4
[19] cli_1.0.1 rstudioapi_0.10 yaml_2.2.0
[22] haven_1.1.2 withr_2.1.2 xml2_1.2.0
[25] httr_1.3.1 knitr_1.20 hms_0.4.2
[28] generics_0.0.2 fs_1.2.6 rprojroot_1.3-2
[31] grid_3.5.1 tidyselect_0.2.5 glue_1.3.0
[34] R6_2.4.0 fansi_0.4.0 readxl_1.1.0
[37] rmarkdown_1.10 modelr_0.1.2 magrittr_1.5
[40] backports_1.1.2 scales_1.0.0 htmltools_0.3.6
[43] rvest_0.3.2 assertthat_0.2.0 colorspace_1.3-2
[46] labeling_0.3 utf8_1.1.4 stringi_1.2.4
[49] lazyeval_0.2.1 munsell_0.5.0 broom_0.5.1
[52] crayon_1.3.4