MTB Expression Analysis
Zhiwei Ma
2018-01-12
Last updated: 2018-01-12
Code version: ee7c372
Construction of Z-scores
For each bacterial infection at certain timepoint, we have six controls and six treatments, denoted as \(X_1,X_2,X_3,X_4,X_5,X_6\) and \(Y_1,Y_2,Y_3,Y_4,Y_5,Y_6\). Then the estimated effect size and standard error are defined below: \[ \hat\beta = \bar Y-\bar X; \\ \hat s = \sqrt{\hat\sigma_x^2/6+\hat\sigma_y^2/6.} \] Here \(\bar X\), \(\bar Y\) are sample means, and \(\hat\sigma_x\), \(\hat\sigma_y\) are sample variances. Then we have \[ \hat\beta|\hat s\sim N(\beta,\hat s^2). \]
Motifs
At 18 hours post-infection, There are eight bacterial infections: “Rv.18”, “Rv+.18”, “GC.18”, “BCG.18”, “Smeg.18”, “Yers.18”, “Salm.18”, “Staph.18”. Here we set \(K=5\), the same as Blischak et al, 2015. The learned motifs are shown below.
source('../code/function.R')Loading required package: Matrixbetahat = read.table("../data/betahat.txt", header = TRUE, sep = "\t",
stringsAsFactors = FALSE)
sebetahat = read.table("../data/sebetahat.txt", header = TRUE, sep = "\t",
stringsAsFactors = FALSE)
z18_k5 = generic.cormotif(betahat[,9:16],sebetahat[,9:16],K=5,mess=FALSE)[1] "Start EM algorithm"plotMotif(z18_k5$bestmotif)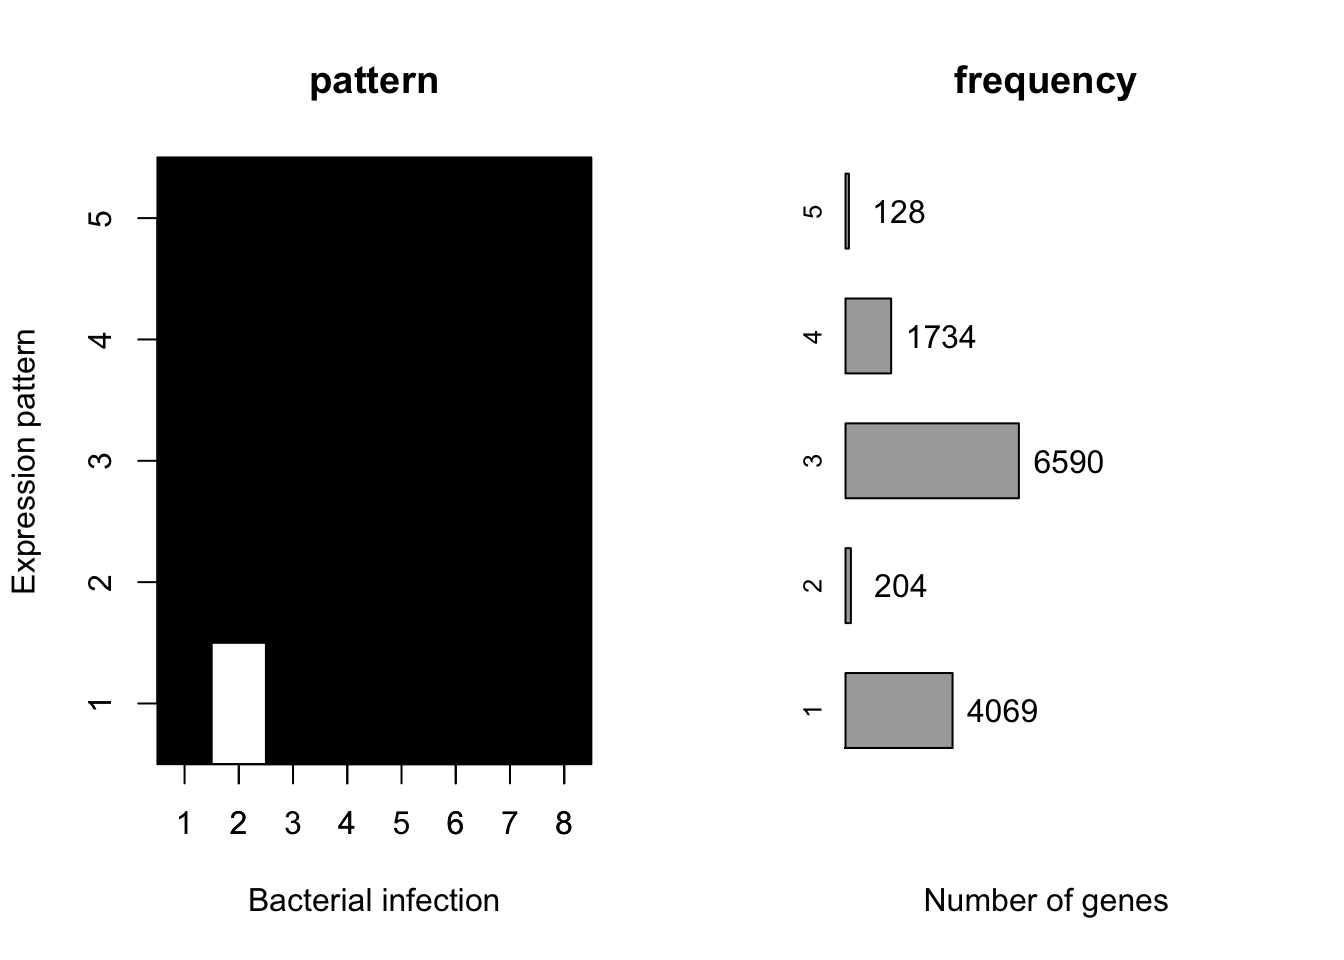
Detection of eQTLs
Download the 198 response eQTLs from Barreiro et al, 2012 (179 out of the 198 were also expressed in our study). Apply our method, we can compute the \(lfsr\) (local false sign rate) for each effect. Set the thresholding at 0.01, we detect 59 differential expression out of 179 genes.
dat_cpm <- read.table("../data/table-s1.txt", header = TRUE, sep = "\t",
                      stringsAsFactors = FALSE)
# The first two columns are gene information
gene_names <- dat_cpm$name
names(gene_names) <- dat_cpm$id

S3 = read.csv("../data/S3.csv",header = FALSE,stringsAsFactors = FALSE)
id = names(gene_names)
ll = intersect(S3[,2],id)
lfsr18 = z18_k5$lfsr[[1]][,1]
list = id[lfsr18<0.01]
a = intersect(S3[,2],list)
print(gene_names[a])
ENSG00000142945 ENSG00000152127 ENSG00000071051 ENSG00000115896
"KIF2C" "MGAT5" "NCK2" "PLCL1"
ENSG00000144118 ENSG00000114631 ENSG00000151422 ENSG00000164182
"RALB" "PODXL2" "FER" "NDUFAF2"
ENSG00000091136 ENSG00000166508 ENSG00000131669 ENSG00000119977
"LAMB1" "MCM7" "NINJ1" "TCTN3"
ENSG00000107833 ENSG00000149547 ENSG00000110713 ENSG00000171792
"NPM3" "EI24" "NUP98" "RHNO1"
ENSG00000103275 ENSG00000185504 ENSG00000129219 ENSG00000109099
"UBE2I" "C17orf70" "PLD2" "PMP22"
ENSG00000169689 ENSG00000109084 ENSG00000141655 ENSG00000108107
"STRA13" "TMEM97" "TNFRSF11A" "RPL28"
ENSG00000130477 ENSG00000176022 ENSG00000072694 ENSG00000213625
"UNC13A" "B3GALT6" "FCGR2B" "LEPROT"
ENSG00000119812 ENSG00000144485 ENSG00000115718 ENSG00000124356
"FAM98A" "HES6" "PROC" "STAMBP"
ENSG00000180834 ENSG00000213672 ENSG00000093217 ENSG00000118564
"MAP6D1" "NCKIPSD" "XYLB" "FBXL5"
ENSG00000177058 ENSG00000039319 ENSG00000091129 ENSG00000186193
"SLC38A9" "ZFYVE16" "NRCAM" "SAPCD2"
ENSG00000138172 ENSG00000167995 ENSG00000134954 ENSG00000189046
"CALHM2" "BEST1" "ETS1" "ALKBH2"
ENSG00000111726 ENSG00000198056 ENSG00000150977 ENSG00000050438
"CMAS" "PRIM1" "RILPL2" "SLC4A8"
ENSG00000126822 ENSG00000138617 ENSG00000166546 ENSG00000133392
"PLEKHG3" "PARP16" "BEAN1" "MYH11"
ENSG00000102978 ENSG00000182481 ENSG00000141140 ENSG00000006025
"POLR2C" "KPNA2" "MYO19" "OSBPL7"
ENSG00000167670 ENSG00000100030
"CHAF1A" "MAPK1" Session information
sessionInfo()R version 3.4.3 (2017-11-30)
Platform: x86_64-apple-darwin15.6.0 (64-bit)
Running under: macOS Sierra 10.12.5
Matrix products: default
BLAS: /Library/Frameworks/R.framework/Versions/3.4/Resources/lib/libRblas.0.dylib
LAPACK: /Library/Frameworks/R.framework/Versions/3.4/Resources/lib/libRlapack.dylib
locale:
[1] en_US.UTF-8/en_US.UTF-8/en_US.UTF-8/C/en_US.UTF-8/en_US.UTF-8
attached base packages:
[1] stats graphics grDevices utils datasets methods base
loaded via a namespace (and not attached):
[1] compiler_3.4.3 backports_1.1.0 magrittr_1.5 rprojroot_1.2
[5] tools_3.4.3 htmltools_0.3.6 yaml_2.1.14 Rcpp_0.12.13
[9] stringi_1.1.5 rmarkdown_1.6 knitr_1.17 git2r_0.19.0
[13] stringr_1.2.0 digest_0.6.12 evaluate_0.10.1This R Markdown site was created with workflowr